Quick Setup Guide
Get your Tidesy up and running in about 10 minutes
Step 1: Unbox & Assemble
~2 minutes
- Unpack your Tidesy device and the included stand.
- Insert the stand into the slot on the back of the device. Two angle positions are available — 10° (more upright) and 15° (tilted back). The angle markings are printed in blue on the stand.
- Wall mounting: Tidesy can be wall-mounted using flush, plastic hardware to avoid shorting components on the back of the PCB. Do not use metal screws directly against the circuit board.
Port Locations by Model
| Model | USB-C | microSD | Reset | LED |
|---|---|---|---|---|
| TidesyL | Bottom edge | Bottom edge | Back, near USB | None |
| TidesyM | Bottom edge | Bottom edge | Back, near USB | None |
| TidesyS | Back / side | Side slot | Back | RGB |
| TidesyS+ | Bottom edge | Side slot | Back | None |
| TidesyINK | Bottom edge | Side slot | Back | None |
Step 2: Power On & Connect
~1 minute
- Plug in the USB-C cable to a 5V 2A power source (phone charger, USB port, or power bank).
- The boot splash screen will appear on the display within a few seconds.
- On your phone or computer, open WiFi settings and look for the network named TidesySetup.
- Connect to TidesySetup using the password:
tide1234 - Open a web browser and go to
192.168.4.1
Step 3: Configure WiFi
~2 minutes
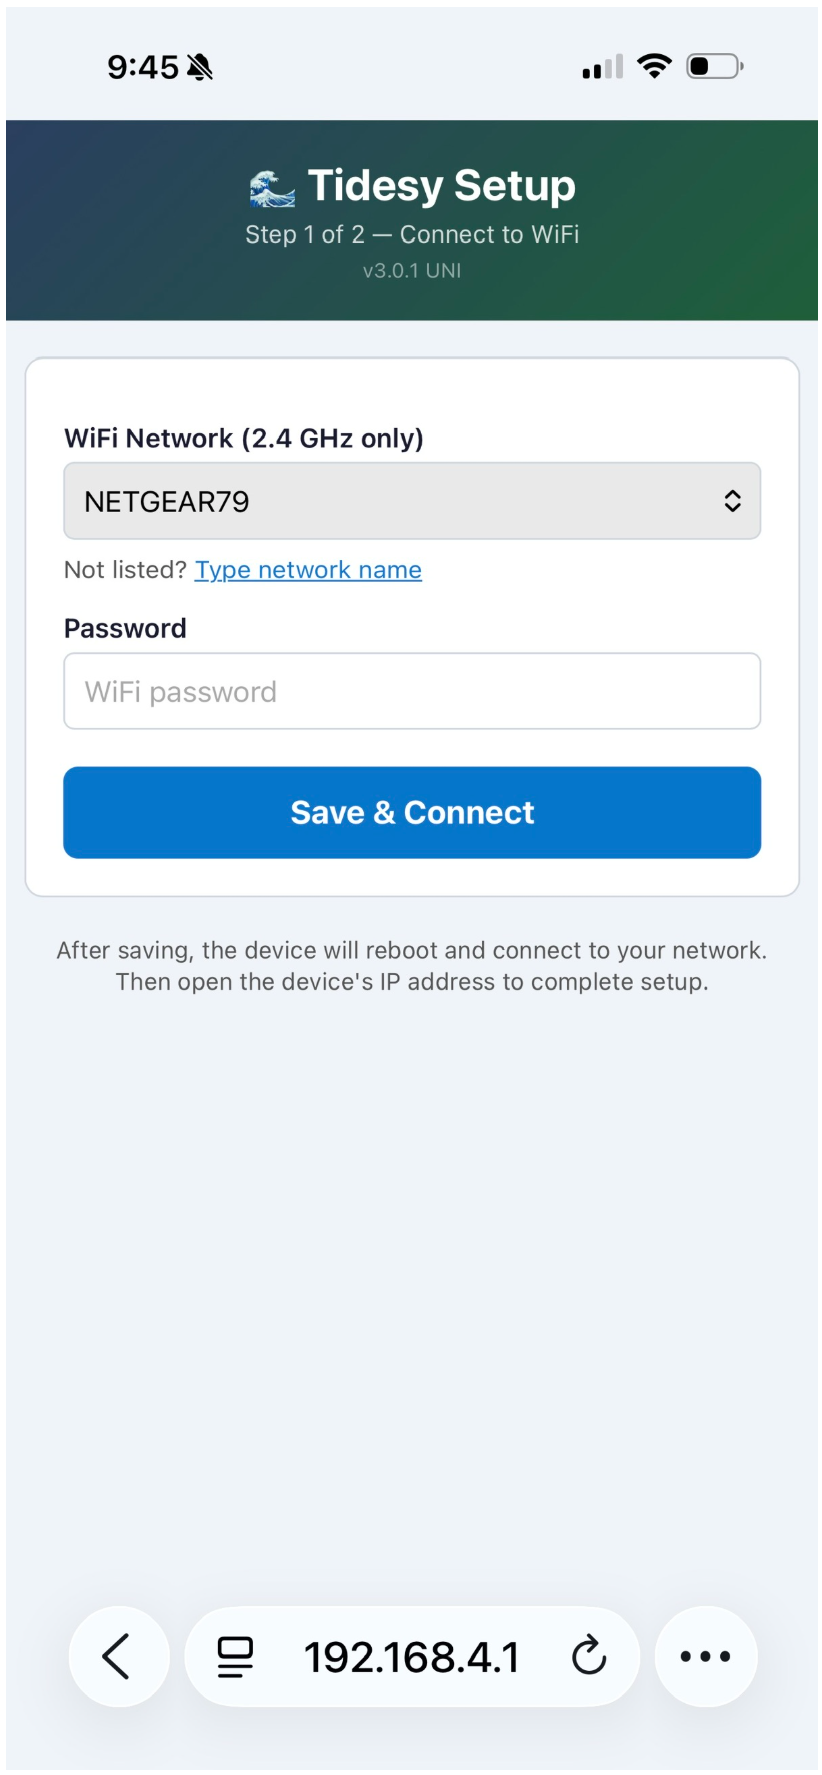
The setup wizard focuses on getting your Tidesy connected to WiFi:
WiFi Configuration
- Select your home WiFi network from the dropdown (2.4 GHz only).
- Enter your WiFi password.
- Tap Verify — Tidesy will test the connection and show your device’s IP address on success.
Tap Save Configuration when done. The device will restart and connect to your WiFi with sensible defaults (both views, alerts on, three Pacific Northwest demo stations).
After First Boot
- Once Tidesy connects to your WiFi, it auto-detects your timezone from your IP address.
- The Edit Settings page opens automatically in your browser, where you can choose your tide stations, adjust display preferences, and customize all settings.
- If the device briefly shows “No internet” while connecting, wait a few seconds — it will connect and proceed.
tidesy.local.
Step 4: First Run Checklist
- WiFi connected (device shows IP address on boot)
- Tide data loading (first fetch takes ~10 seconds)
- Display showing tide graph or large numbers
- Web dashboard accessible at
http://tidesy.local
Quick Troubleshooting
| Problem | Solution |
|---|---|
| Can't find TidesySetup network | Turn off WiFi on your phone, wait a few seconds, and turn it back on. If it still doesn’t appear, unplug Tidesy, wait 15 seconds, and plug it back in. Make sure your phone/computer is on 2.4 GHz, not 5 GHz only. |
| Setup page won't load | Be patient — your phone runs through WiFi handshake tasks when connecting to a new network for the first time. Wait up to 30 seconds. If it still doesn’t load, try navigating directly to 192.168.4.1 in your browser. |
| WiFi verification fails | Double-check your WiFi password. Ensure the network is 2.4 GHz. |
Table of Contents
Detailed reference for every Tidesy feature
What’s New in 3.1.0
If you’re upgrading from 3.0.x, here’s what’s new in your device:
- Tidesy Cloud — optional cloud-hosted dashboard at
app.tidesy.comso you can check your tides from anywhere, not just your home network. Includes a free 6-month trial. - Environment cards (Section 5.2) — rain forecast overlay, UV index, air quality, wave height + water temperature, and sun/moon overlay.
- Clamming view (Section 5.3) — Pacific Northwest razor clam dig windows + closures, fed live from WDFW.
- Flooding (inundation) overlay (Section 5.4) — color-coded warning band when a forecast high tide is set to exceed NOAA flood thresholds.
- Alert area maps in Section 6 — the NWS-defined affected polygon is now drawn on both the device alert view and the web dashboard.
- USB Web Updater in Section 11 — browser-based firmware flashing for devices on restrictive networks.
Nothing in your existing setup changes — all new features are opt-in or appear only when relevant data is available.
Detailed Manual
Complete reference for all Tidesy features and settings
1. About Tidesy
Where It Started
We live on the edge of the Pacific, where the rhythm of the tides shapes our days. The Washington coast is more than just home. It is a place of windswept beauty, long walks on the beach, and the joyful chaos of dogs chasing tennis balls through salt air and driftwood. Every morning begins with the same question: when will we go out? The answer depends entirely on the tide. Rising or falling, high or low, it determines whether we explore the sandbars, dodge sneaker waves, or simply stroll with paws and bare feet in the surf.
But it is not just the tide. Coastal warnings, wind speed, and wind direction all play a role in our daily adventures. If it is blowing hard from the southwest, we know the dogs will come home with sand in their eyes and seafoam in their fur. We learned to check conditions before heading out, but juggling apps, forecasts, and tide charts felt clunky and disconnected from the rhythm of our lives. We wanted something simpler. Something that felt like part of the beach itself.
The Spark
That is what sparked the idea for Tidesy. A small, elegant device that could live on a desk or kitchen counter and quietly do the work for us. It would show us the tide, the wind, the warnings, all at a glance. No fumbling with phones. No digging through websites. Just a clear, friendly display that tells you what you need to know to plan your day, whether it is a long walk, a quick fetch session, or a spontaneous expedition down the coast.
Building It
With a career spent building software products, the tools to bring Tidesy to life were already at hand. Tidesy is written in C++ and taps into publicly available government data sources to pull in real-time tide predictions, weather conditions, and coastal alerts. The interface is designed to be warm and intuitive, with visuals that feel like part of the coastal landscape. It is not just a device. It is a companion for coastal living, built with the same care and curiosity that we bring to every walk on the beach.
Part of the Rhythm
Now, Tidesy is part of our daily routine. It sits quietly, glowing with the pulse of the ocean, helping us decide when to head out and what to expect. The dogs still race for the ball. The wind still shifts. The tide still rolls in and out. But now, we are ready for it all.
What Tidesy Does
Tidesy is a dedicated smart display that brings real-time coastal data to your desk, wall, or countertop:
- Tide Predictions — 24-hour tide curves and high/low values from NOAA harmonic station data, updated every 6 minutes.
- Current Weather — Temperature and wind conditions from MET Norway’s open weather API.
- NWS Weather Alerts — Active weather alerts (coastal flood, high surf, storm warnings, etc.) from the National Weather Service.
- Multi-Station Monitoring — Track up to 3 tide stations simultaneously, cycling automatically.
- Web Dashboard — Full-featured web interface accessible from any device on your local network.
- Vestaboard Integration — Display tide data on a Vestaboard Flagship split-flap display.
Who It’s For
Boaters, fishers, beachgoers, surfers, coastal property owners, dock and marina operators — anyone who lives, works, or plays near the water and wants a glanceable, always-on tide display.
2. Understanding Tides
What Are Tides
Tides are the regular rise and fall of sea level caused by the gravitational pull of the Moon and Sun on Earth’s oceans. Most coastal locations experience semidiurnal tides (two highs and two lows per day), though some areas see diurnal (one high, one low) or mixed patterns.
Tide Datum
A datum is the reference plane from which tide heights are measured. Tidesy uses MLLW (Mean Lower Low Water) by default — the average height of the lower of the two daily low tides over a 19-year period. This means:
- Positive values = water level is above the datum (above the average low-low)
- Negative values = water level is below the datum (unusually low tide)
All tide heights on Tidesy are displayed in feet above/below MLLW unless you change the datum in settings.
NOAA Harmonic Stations
NOAA operates a network of approximately 3,000 permanent tide stations around the U.S. coastline. Each station uses harmonic analysis — mathematical models based on decades of water level observations — to predict future tide levels. Tidesy downloads predictions directly from these stations.
Reading Tide Values
On the Tidesy display and web dashboard:
- +3.2 ft means the water is 3.2 feet above MLLW (a moderately high tide)
- -0.5 ft means the water is 0.5 feet below MLLW (a very low tide)
- Typical tidal ranges vary from 1–2 ft (Gulf Coast) to 8–12 ft (New England, Pacific Northwest)
Glossary of Tide Terms
- MLLW (Mean Lower Low Water)
- The average of the lower of the two daily low tides, computed over a 19-year tidal epoch. The standard vertical datum for U.S. nautical charts.
- MSL (Mean Sea Level)
- The average sea level over a 19-year period, used as a general reference.
- Datum
- A fixed reference point or surface from which tide heights are measured.
- Slack Water
- The brief period between tidal flows when the current is near zero — occurs at the turn between flood and ebb.
- Flood Tide
- The incoming tide; the period when water level is rising.
- Ebb Tide
- The outgoing tide; the period when water level is falling.
- Spring Tide
- Tides with the greatest range, occurring near new and full moons when the Sun and Moon align.
- Neap Tide
- Tides with the smallest range, occurring near the first and third quarter moons.
- Harmonic Constituent
- A mathematical component used to model tidal patterns; each constituent represents the influence of a specific astronomical cycle.
- Semidiurnal
- A tidal pattern with two high tides and two low tides of roughly equal height each day.
- Diurnal
- A tidal pattern with one high tide and one low tide per day.
- Mixed Tide
- A tidal pattern with two highs and two lows per day, but with significant inequality in their heights.
3. Tidesy Models
Comparison Table
| Feature | TidesyL | TidesyM | TidesyS | TidesyS+ | TidesyINK |
|---|---|---|---|---|---|
| Screen Size | 7" | 5" | 2.8" | 3.5" | 4.2" |
| Resolution | 800×480 | 800×480 | 320×240 | 480×320 | 400×300 |
| Display Type | Color LCD | Color LCD | Color LCD | Color LCD | E-Paper B&W |
| Touch | Yes (touchscreen) | Yes (touchscreen) | None | None | None |
| Graph Interaction | Yes | Yes | No | No | No |
| Bar Chart Overlay | Yes | Yes | No | No | No |
| Color Customization | Yes | Yes | Yes | Yes | No (B&W) |
| Battery Capable | No | No | No | No | Yes |
| LED Indicator | RGB | RGB | 3 LEDs / RGB | RGB | None |
TidesyL (7") Flagship
The largest Tidesy model with a 7-inch 800×480 color LCD and touchscreen. Tap the tide graph to see the tide value at any point in time. Tap the large number view to toggle a bar chart overlay. Ideal for a desk, shelf, or wall-mounted display.

TidesyM (5") Mid-size
Same 800×480 resolution and touchscreen as TidesyL, in a more compact 5-inch form factor. Identical software features including graph interaction and bar chart overlay.
TidesyS (2.8") Compact
A compact 2.8-inch 320×240 color display. Great for a desktop or nightstand. No touch interaction on the display — use the web dashboard for full control.
The display shows the same detail and large views as the 7" and 5" models, scaled to 320×240. All tide data, weather, and graph features are available.
TidesyS+ (3.5") Enhanced Compact
An enhanced compact model with a 3.5-inch 480×320 display. Wider screen provides more room for tide data. Same features as TidesyS with a larger viewing area.
TidesyINK (4.2" E-Paper) Battery-Capable
A 4.2-inch 400×300 monochrome e-paper display. Sunlight-readable with no backlight. Can run on battery power, sleeping between 6-minute refresh cycles.
Power Modes
| Mode | WiFi | Refresh | Best For |
|---|---|---|---|
| High | Always on | Continuous | Plugged-in use |
| Balanced | On/off per cycle | Every 6 min | General use |
| Low | Minimal | Sleeps between | Battery operation |
4. Setup Wizard (Detailed)
Connecting to the Hotspot
When Tidesy has no saved WiFi configuration (first boot or after factory reset), it creates a WiFi hotspot:
- Network name:
TidesySetup - Password:
tide1234 - Setup URL:
http://192.168.4.1
WiFi Configuration (Setup Hotspot)
Tidesy supports 2.4 GHz WiFi only. 5 GHz networks are not supported. Most routers broadcast both bands; make sure you select the 2.4 GHz network.
- Network dropdown: Lists all detected 2.4 GHz networks, sorted by signal strength.
- Password field: Enter your WiFi password.
- Verify button: Tests the WiFi connection and displays the device’s IP address on success.
Automatic Timezone Detection
After connecting to WiFi for the first time, Tidesy auto-detects your timezone from your IP address. The timezone is refreshed daily to handle daylight saving time transitions automatically. You do not need to set your timezone manually.
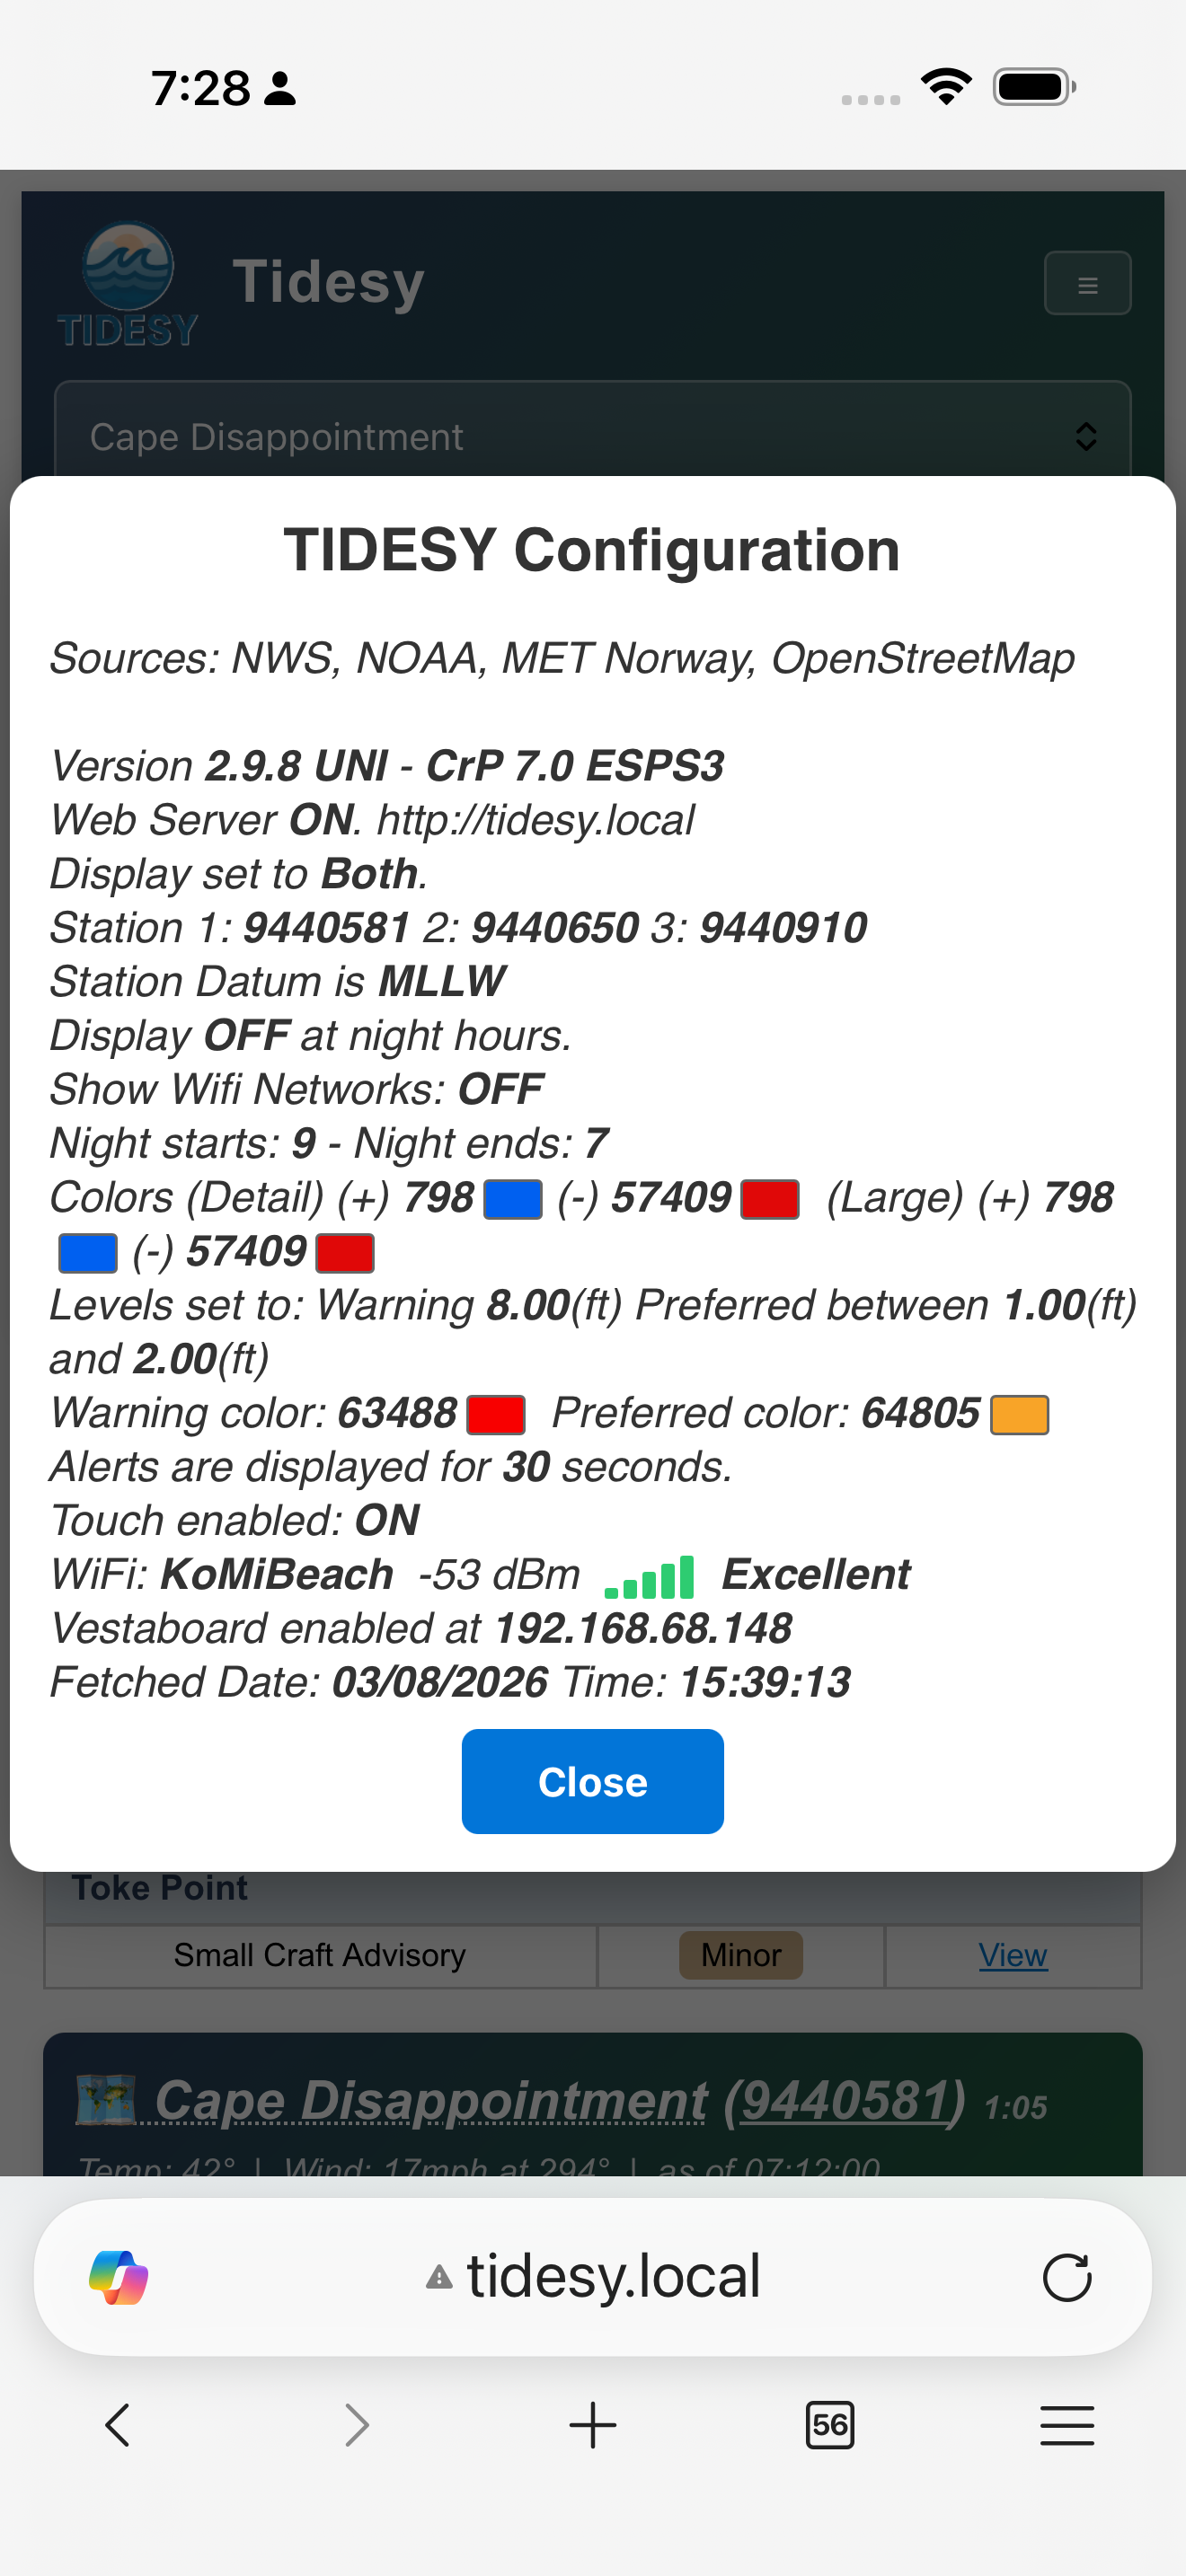
If you need to override the timezone temporarily (e.g., while traveling), use the TZ override option in the Config popup on the web dashboard. This override lasts for the current session only and resets on reboot.
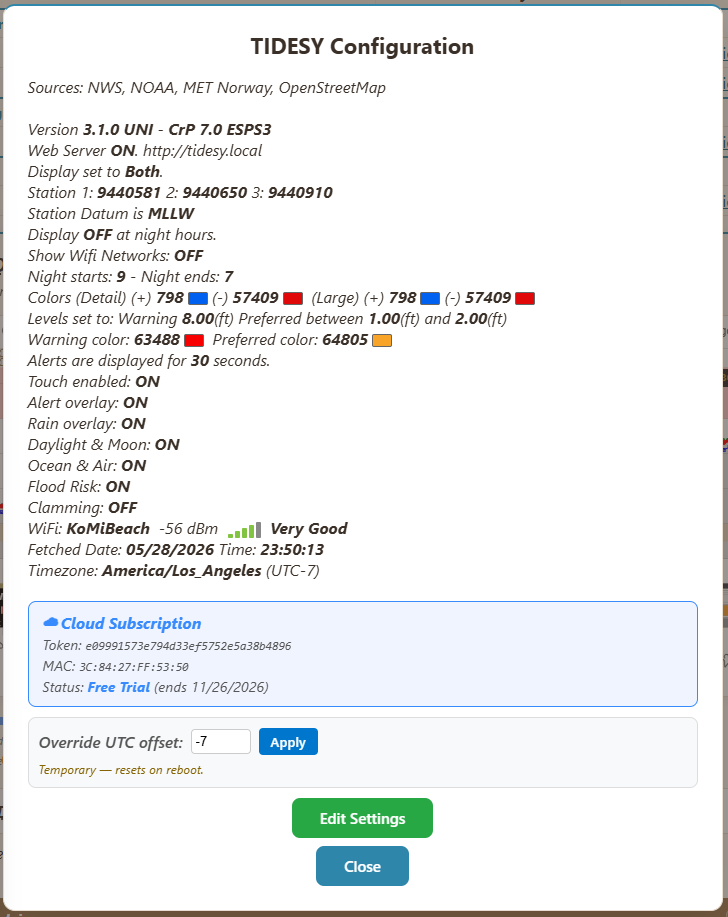
The Config popup showing the UTC offset override at the bottom.
Edit Settings (Web Dashboard)
After the first boot, the Edit Settings page at tidesy.local opens automatically. This is where you configure all device settings — stations, display, location, alerts, colors, Vestaboard, and more. You can return to Edit Settings at any time from the web dashboard.
Station Selection
Tidesy uses NOAA harmonic tide stations for predictions. On first setup, it downloads a directory of ~3,000 stations.
- One-time download: Takes approximately 60 seconds. Runs in the background. A progress banner shows the download status.
- Search: Type a station name or NOAA station ID in the search box. Results appear as you type.
- State filter: Narrow results by state using the dropdown.
- Near Me: Click the Near Me button to find the closest stations to your location, shown with distances in miles.
- Up to 3 stations: Click a search result to assign it to Station 1, 2, or 3 using the +1, +2, +3 buttons.
- Refresh Stations: Click the Refresh Stations button to re-download the station directory from NOAA. Use this if stations appear outdated or if the initial download was interrupted.
- Tide datum: Default is MLLW. Most users should leave this unchanged.
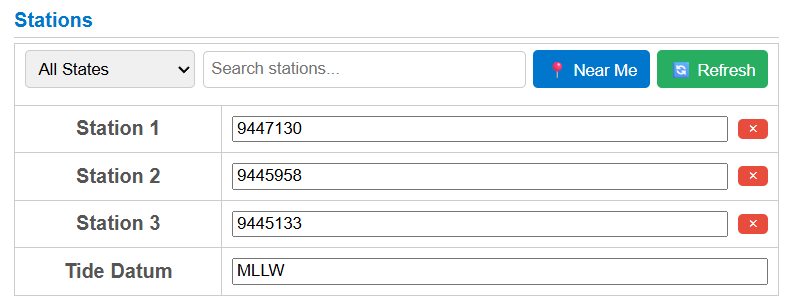
The station picker in Edit Settings with state filter, search, Near Me, and Refresh buttons.
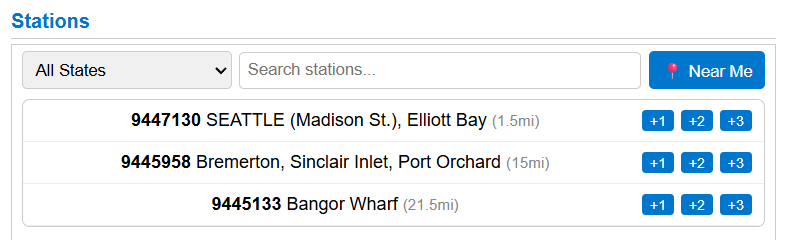
Near Me results with distances and +1/+2/+3 assignment buttons.
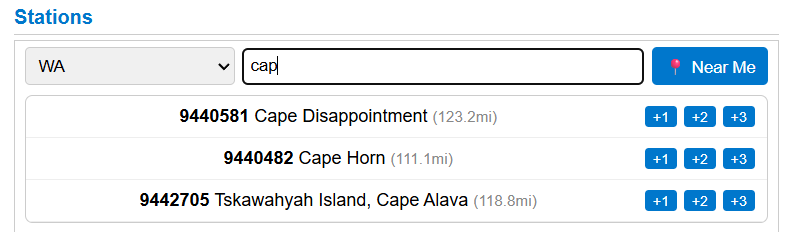
State filter (WA) combined with search (“cap”).
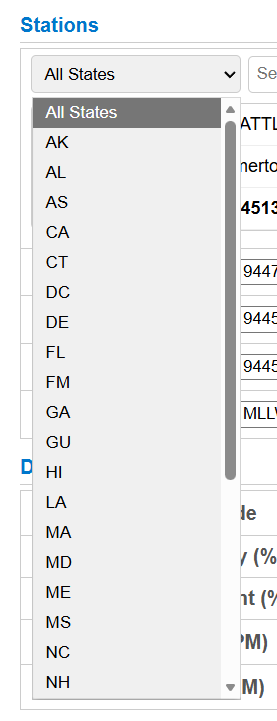
The state filter dropdown with all U.S. states and territories.
Display Settings
- Format: Detail (24-hour tide graph), Large (big tide numbers), or Both (auto-cycles between the two).
- Day brightness: 1–100% slider. Controls backlight intensity during daytime hours.
- Night brightness: 0–100% slider. Set to 0% to turn the screen completely off at night.
- Night start: PM hour (0–12). When night brightness begins.
- Night end: AM hour (0–12). When day brightness resumes.
Alert Settings
- Show Alerts toggle: Enable or disable NWS weather alert display on the device.
- Alert display duration: 10–60 second slider. How long each alert is shown before cycling to the next.
Tide Level Settings
- Warning level: −10 to +30 ft (0 = disabled). When the tide reaches this height, a colored horizontal band appears on the graph. Useful for dock clearance, flooding thresholds, or launching conditions.
- Preferred range (from/to): −10 to +30 ft (0 = disabled). A colored band shows your ideal tide range on the graph. Useful for fishing, surfing, or boat ramp access windows.
Color Settings
TidesyINK does not have color settings (monochrome display).
Six color pickers let you customize the display palette:
- Graph positive / negative: Fill colors for the tide curve above and below the zero line.
- Numbers positive / negative: Text colors for positive and negative tide values in Large view.
- Warning color: Color of the warning level band on the graph.
- Preferred color: Color of the preferred range band on the graph.
My Location
Your location is used for weather data, weather alerts, and suggested station distances. Three ways to set it:
- Interactive map: Click/tap on the Leaflet/OpenStreetMap map to place a pin. Drag the marker to fine-tune your position. The map pre-caches a large tile area so you can scroll and zoom in rural areas without losing the map.
- Manual entry: Type latitude and longitude values directly. Both fields accept negative values (south latitude, west longitude).
- Detect from IP: Button that estimates your location from your internet connection.
Per-Network Location Memory
Tidesy remembers the location you set for each WiFi network. When you move the device to a different WiFi network and re-enter setup, it automatically recalls the location you previously picked for that network. If you connect to a new network for the first time, Tidesy detects your approximate location automatically and saves your chosen location when you save the form. Use the Detect from IP button if you want to refresh the detected location.
Vestaboard Settings
Vestaboard configuration is available in the Edit Settings page on the web dashboard. If a Vestaboard Flagship is detected on your network, the Vestaboard section appears with the following options:
- Enable Vestaboard: Toggle to enable or disable the Vestaboard integration.
- IP address: Auto-detected during network scan. You can also enter it manually.
- Local API key: The 22-character encoded key from the Vestaboard app (device settings > Local API). A clipboard paste button is provided.
- Update interval: Single dropdown with 5 options:
- Change with device — VB mirrors whatever the Tidesy display shows, updating instantly when the view or station changes.
- 20m / 30m / 1h / 2h — Independent cycle through all stations and views at the selected interval.
- Bar colors: Choose Vestaboard tile colors for positive tides, negative tides, zero mark, warning level, and preferred range.
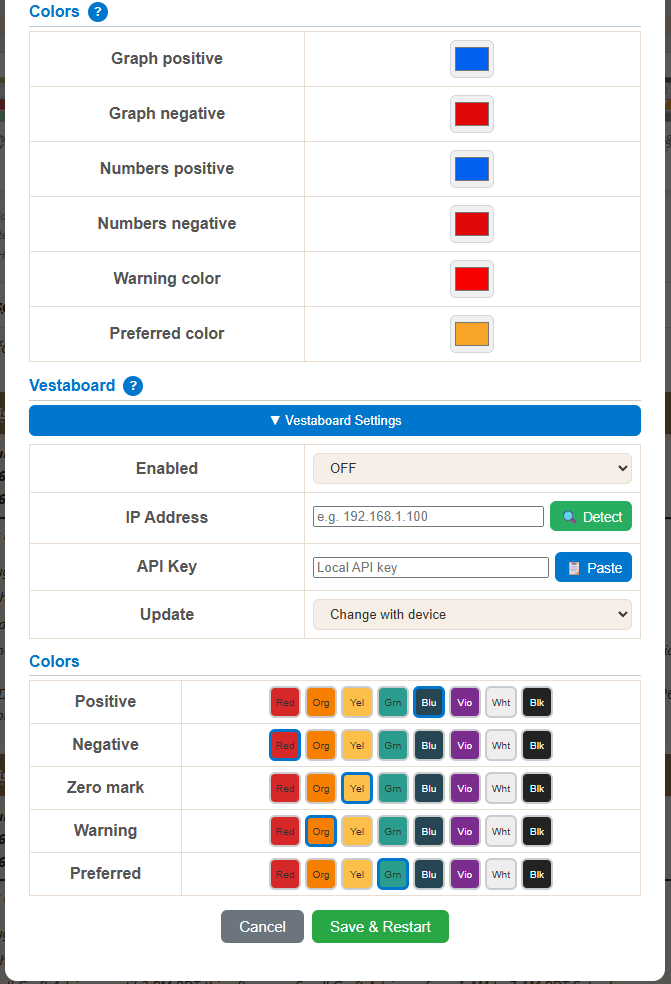
Colors and Vestaboard sections in Edit Settings.
5. Device Views
5.1 — Primary Views
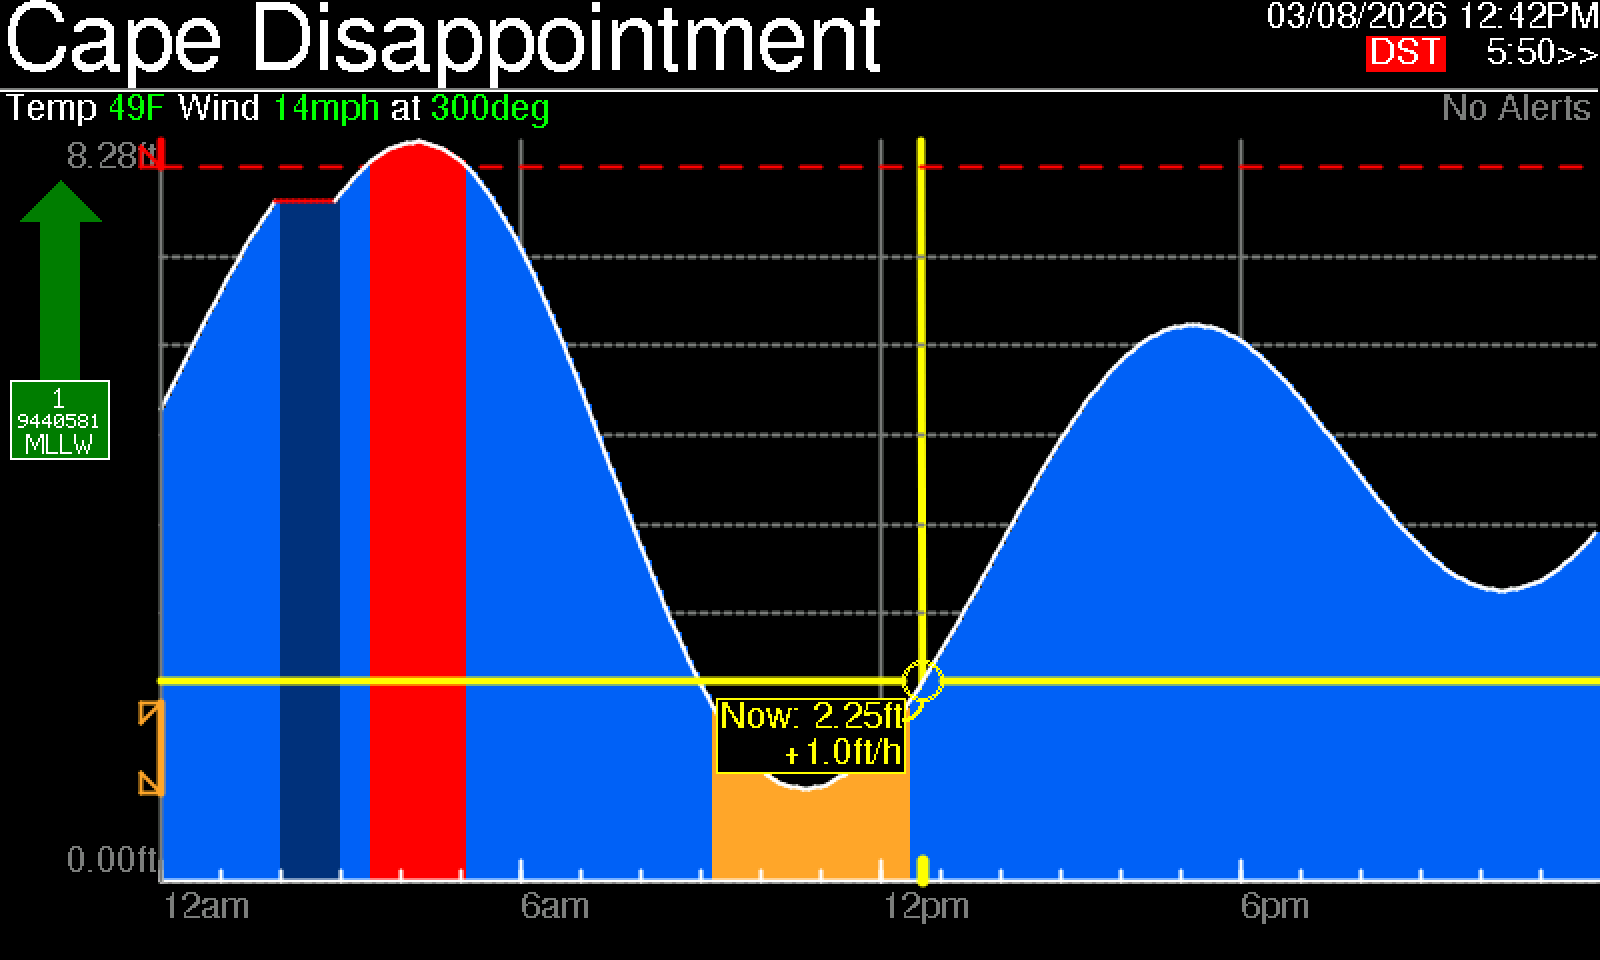
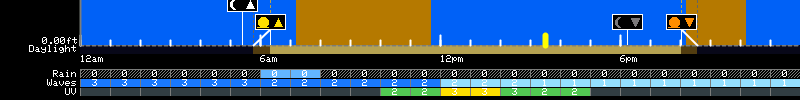
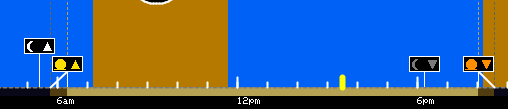
Detail View (24-Hour Tide Graph)
The detail view shows a 24-hour tide curve as a filled graph:
- Station name header: White text on dark gradient bar at the top.
- Y-axis: Tide height range (min to max for the day) with labeled tick marks.
- X-axis: 24 hours, divided by 4 quarter-line markers (6-hour intervals).
- Data points: 240 values at 6-minute intervals, interpolated into a smooth curve.
- Positive tides: Filled with the positive graph color (default: orange/blue depending on model).
- Negative tides: Filled with the negative graph color (default: pink/red).
- Current time marker: Yellow vertical line showing the current position in the 24-hour period.
- Live data point: Animated yellow circle at the current tide level with a 4-second pulse cycle.
- “Now” box: Two-line info box near the live data point showing the current tide value (e.g., “Now: 3.8ft”) and the rise/sink rate (e.g., “+1.2ft/h”). Text is always yellow on a black background. The box outline turns the preferred or warning color when the tide is in those zones, and blinks with a 4-second cycle to draw attention.
- Foot-level grid lines: Light dashed horizontal lines at each whole-foot level behind the tide curve for easier reading.
- Warning level band: Colored horizontal zone across the graph (if configured).
- Preferred range band: Colored horizontal zone showing your ideal tide range (if configured).
- Conditions: Temperature and wind displayed in the bottom-right area.
- Next H/L: Next high and low tide values and times displayed at the top.
- Status badges: Small status indicators appear near the countdown timer:
- DST (white on red) — shown on days when a daylight saving time transition occurs. The tide graph uses a red line segment and dimmed fill to mark the affected hour.
- ! or M — alert severity indicator.
1
2
3
4
5
6
7
8
9
Here is the same view on a daylight-saving-time transition day, with the DST badge visible in the top-right corner and a red line / dimmed fill marking the affected hour:
 1
2
3
4
5
6
7
8
9
10
11
1
2
3
4
5
6
7
8
9
10
11
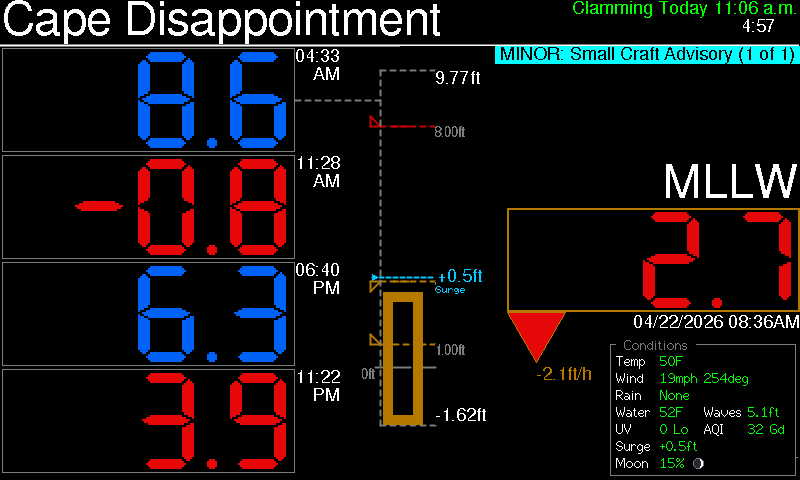
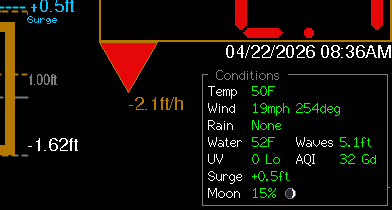
Large View (Big Numbers)
The large view displays the day’s four tide values in large, easy-to-read digits:
- 4 tide values: High/Low/High/Low in large text with times in 12-hour AM/PM format.
- Rising/falling indicator: Animated triangle pointing up (rising) or down (falling) with a 4-second fade cycle.
- Tide rate badge: Shows the current rate of change (e.g., "+2.3 ft/h").
- Weather area: Temperature, wind speed, and wind direction at the bottom.
- Current time: Displayed in the bottom area.
- Bar chart overlay: TidesyL TidesyM only — tap the screen to toggle a bar chart showing tide levels across the day.
1
2
3
4
5
6
7
8
9
10
The triangle and rate badge change with tide direction: a blue upward triangle with a positive rate (e.g., +1.1 ft/h) means the tide is rising, while a red downward triangle with a negative rate (e.g., −2.1 ft/h) means it is falling. The triangle fades in and out on a 4-second cycle so the direction is easy to spot from across the room.
View Cycling
When the display format is set to Both, Tidesy auto-cycles between the Detail and Large views. The cycle happens each time the data refreshes (every 6 minutes).
Station Cycling
If you have configured 2 or 3 tide stations, Tidesy rotates through them automatically. Each station is displayed for one refresh cycle (6 minutes) before advancing to the next.
6-Minute Refresh
All tide predictions, weather data, and alert information refresh automatically every 6 minutes. This matches the NOAA tide prediction interval (6-minute data points) and ensures the display stays current.
Daylight Saving Time Handling
On DST transition days, NOAA returns a different number of predictions (230 in spring, 250 in fall instead of the usual 240). Tidesy automatically detects this by parsing prediction timestamps and adjusts the graph accordingly:
- Spring forward: The missing hour (typically 2–3 AM) is shown on the graph as a red line with a dimmed fill, indicating interpolated data.
- Fall back: Duplicate predictions for the repeated hour are skipped, with a red line segment marking the transition point.
A DST badge (white text on red background) appears on the detail view during DST transition days.
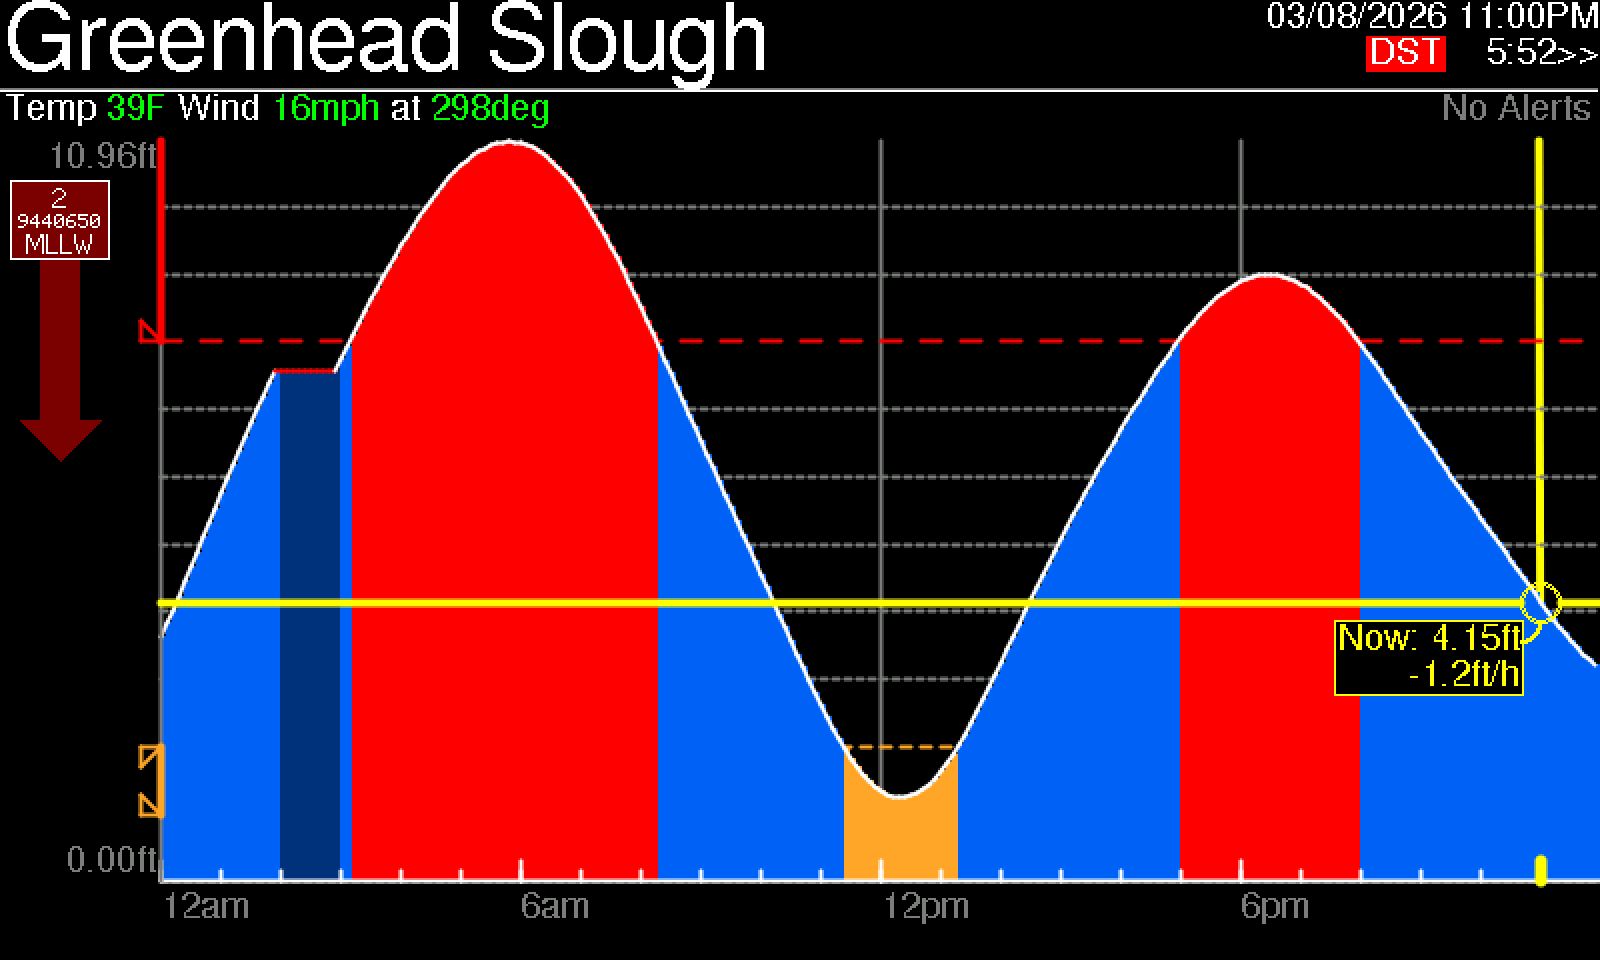
Detail view on a spring-forward day. Notice the DST badge in the top right, and the red line with dimmed fill between 2–3 AM where the missing hour is interpolated.
Status Badges & Countdown Timer
The top-right corner of the display shows status badges and a countdown timer:
Example: DST day with active alert

DST badge + ! alert indicator + countdown timer
| Badge | Meaning |
|---|---|
| DST | Daylight saving time transition day detected. The tide graph marks the affected hour with a red line and dimmed fill. Detail view only. |
| ! | Active weather alert at severity Severe or Extreme. |
| M | Active weather alert at severity Minor or Moderate. |
| 5:21>> | Countdown timer showing minutes and seconds until the next data refresh. The >> arrows animate to indicate the device is running. |
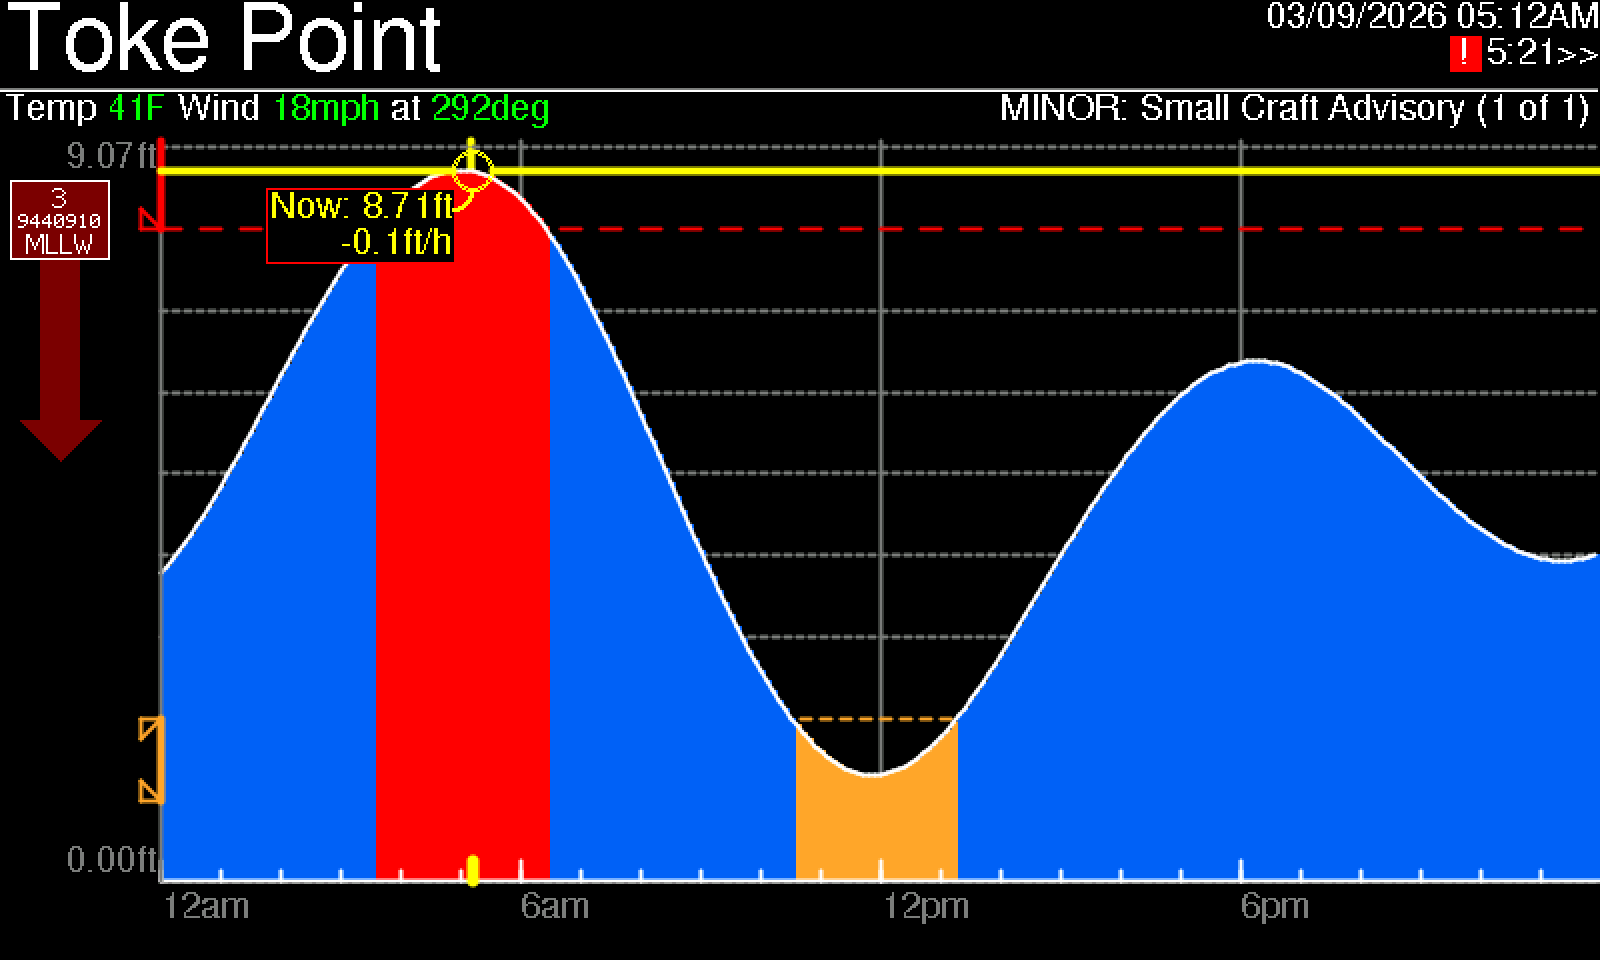
Here is the detail view with an active alert — note the ! badge and the yellow alert banner across the top:
5.2 — Environment Cards
Tidesy can show additional environmental data alongside tides — rain timing, sun exposure (UV), air quality, surf conditions, and sunrise / sunset / moon phases. Each one is independently toggleable in the device settings under Environment, so you can show only what’s relevant to where you are.
Rain Forecast Overlay
A thin strip across the bottom of the detail view shows the next several hours of forecast precipitation. Blue blocks indicate rain probability and intensity at each hour, scaled so a fully filled block means heavy rain. The overlay disappears when no rain is forecast in the window.
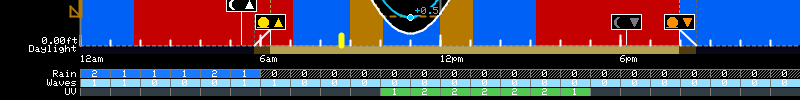
Rain overlay on a clean tide view — the strip below the tide curve marks each hour with a probability-weighted block.
UV Index
A daytime UV reading appears as a compact card. The number is the current UV index and the label (Low / Moderate / High / Very High / Extreme) reflects the standard EPA scale. The card hides automatically at night when UV is irrelevant.
Air Quality
Current AQI (Air Quality Index) with the corresponding category — Good / Moderate / Unhealthy for Sensitive Groups / Unhealthy / Very Unhealthy / Hazardous — color-coded to the EPA scale. Useful for deciding whether to open the windows or take the morning run outside.
Waves and Water Temperature
For coastal stations, Tidesy shows current significant wave height and water temperature in a combined card. Wave height is the average of the highest one-third of waves — the value you’d hear in a marine forecast. Water temperature is measured at the nearest NOAA buoy.
Sun and Moon Overlay
Sunrise, sunset, and current moon phase are drawn directly on the detail view’s timeline. Sunrise and sunset appear as small tick marks at the correct positions on the 24-hour x-axis. The moon icon shows the current phase (new, waxing crescent, first quarter, waxing gibbous, full, waning gibbous, last quarter, waning crescent).
5.3 — Clamming View
For Pacific Northwest beaches with active razor clamming, Tidesy shows the upcoming dig windows directly on the tide view. The dig window is the period around evening low tide when the Washington Department of Fish & Wildlife (WDFW) has authorized harvest.
- Green overlay band: Marks an open dig window on the detail view’s tide curve. The width of the band shows the exact start and end times for legal harvest that evening.
- Closure indicator: When a beach is closed (marine toxin advisory, season ended, etc.) the band is replaced by a red “Closed” note explaining why.
- Detail page: A separate page shows a full table of upcoming approved dig windows for the configured beach, sourced directly from WDFW’s public schedule.
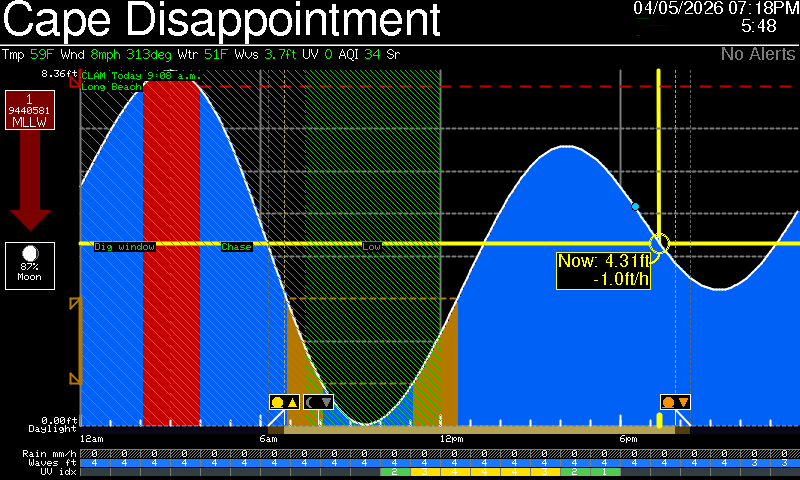
Detail view with the dig-window band drawn over the evening low tide. The band only renders during the authorized hours.
The full clamming schedule page is laid out as a calendar-style table: one row per upcoming evening, listing the date, the approved dig window start and end times in 12-hour format, and the low tide value during the window. Days outside the season or under a WDFW advisory show as gray rows with the closure reason in place of times. The page rotates into the cycle a few seconds after the tide views so you don’t miss your next opportunity.
5.4 — Flooding (Inundation) Overlay
For stations where coastal flooding is a concern, Tidesy shows a flood-risk overlay on the detail view. When the day’s predicted high tide is forecast to exceed the NOAA minor / moderate / major flood thresholds for your station, a colored band appears across the top portion of the tide curve marking the at-risk hours.
- Yellow band: Minor flooding likely — nuisance-level water on low-lying roads and shorelines.
- Orange band: Moderate flooding likely — significant water impact on structures near the shore.
- Red band: Major flooding likely — serious threat to property and safety.
- Auto-hiding: The overlay disappears when no flood threshold will be crossed in the next 24 hours.
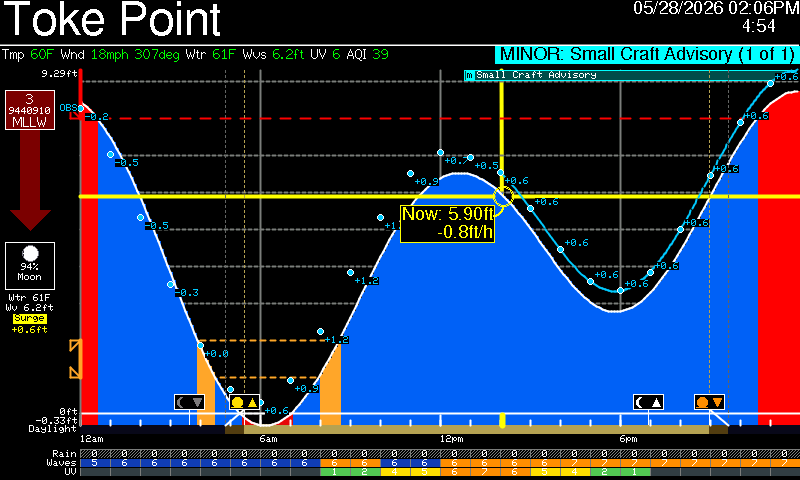
Flood-risk overlay band on a high tide forecast to exceed the minor flooding threshold.
5.5 — TidesyINK-Specific Display
- Monochrome only: Black and white rendering — no color customization available.
- Font: FreeSans family at various sizes (8pt, 9pt, 12pt, 18pt).
- No animations: E-paper cannot animate. The live data point and rising/falling indicator are static.
- 6-minute sleep cycle: In Low power mode, the device sleeps between refreshes to conserve battery.
6. Weather Alerts (NWS)
What Are NWS Alerts
The National Weather Service (NWS) issues active weather alerts for locations across the United States. Tidesy checks for alerts at each station’s coordinates and displays them on the device and web dashboard.
Data Source
Alerts are fetched from api.weather.gov/alerts/active using each station’s latitude and longitude. The NWS API is free, public, and requires no authentication.
Severity Levels
| Severity | Color | Meaning |
|---|---|---|
| Minor | Gray/Brown | Low-impact advisories — minor weather events or informational statements. |
| Moderate | Yellow | Significant weather events — conditions that may cause inconvenience or minor danger. |
| Severe | Orange | Dangerous conditions — significant threat to life or property. |
| Extreme | Red | Life-threatening situations — immediate action may be necessary. |
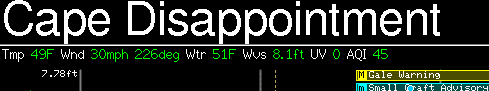
Alert Display on Device
- Cycling banner: When alerts are active, a colored banner appears at the top of the display showing the severity level, event name, and count (e.g., "1 of 3").
- Color-coded: The banner color matches the severity level (red, orange, yellow, or brown/gray).
- Cycle timing: Each alert is shown for the configured alert delay (10–60 seconds) before advancing to the next.
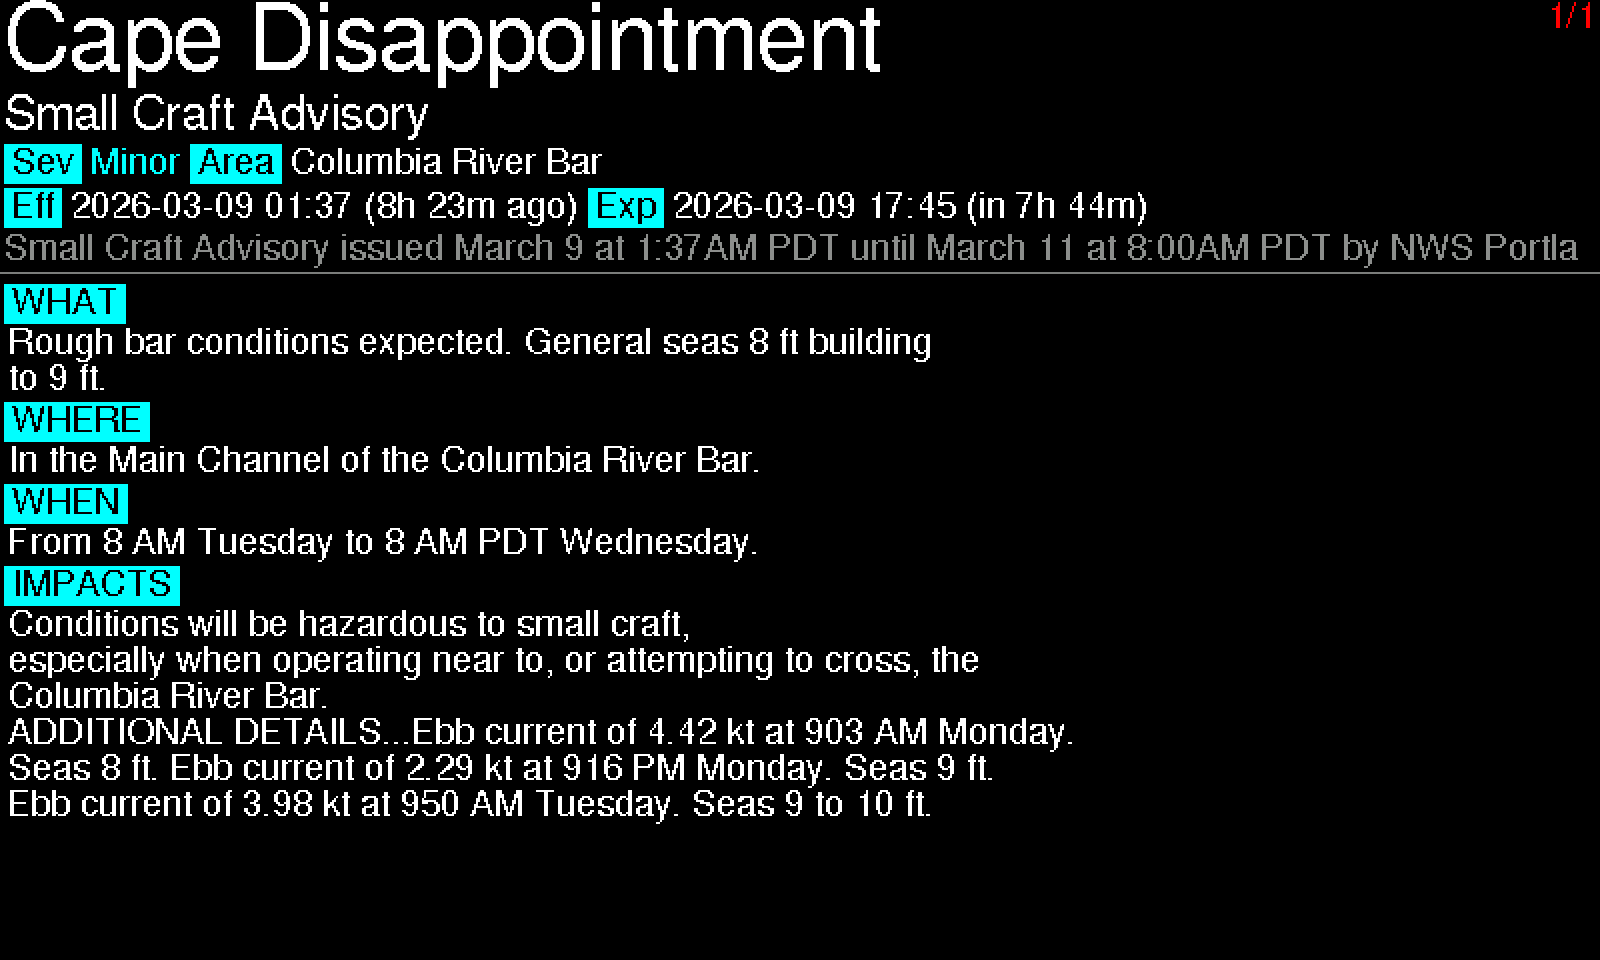
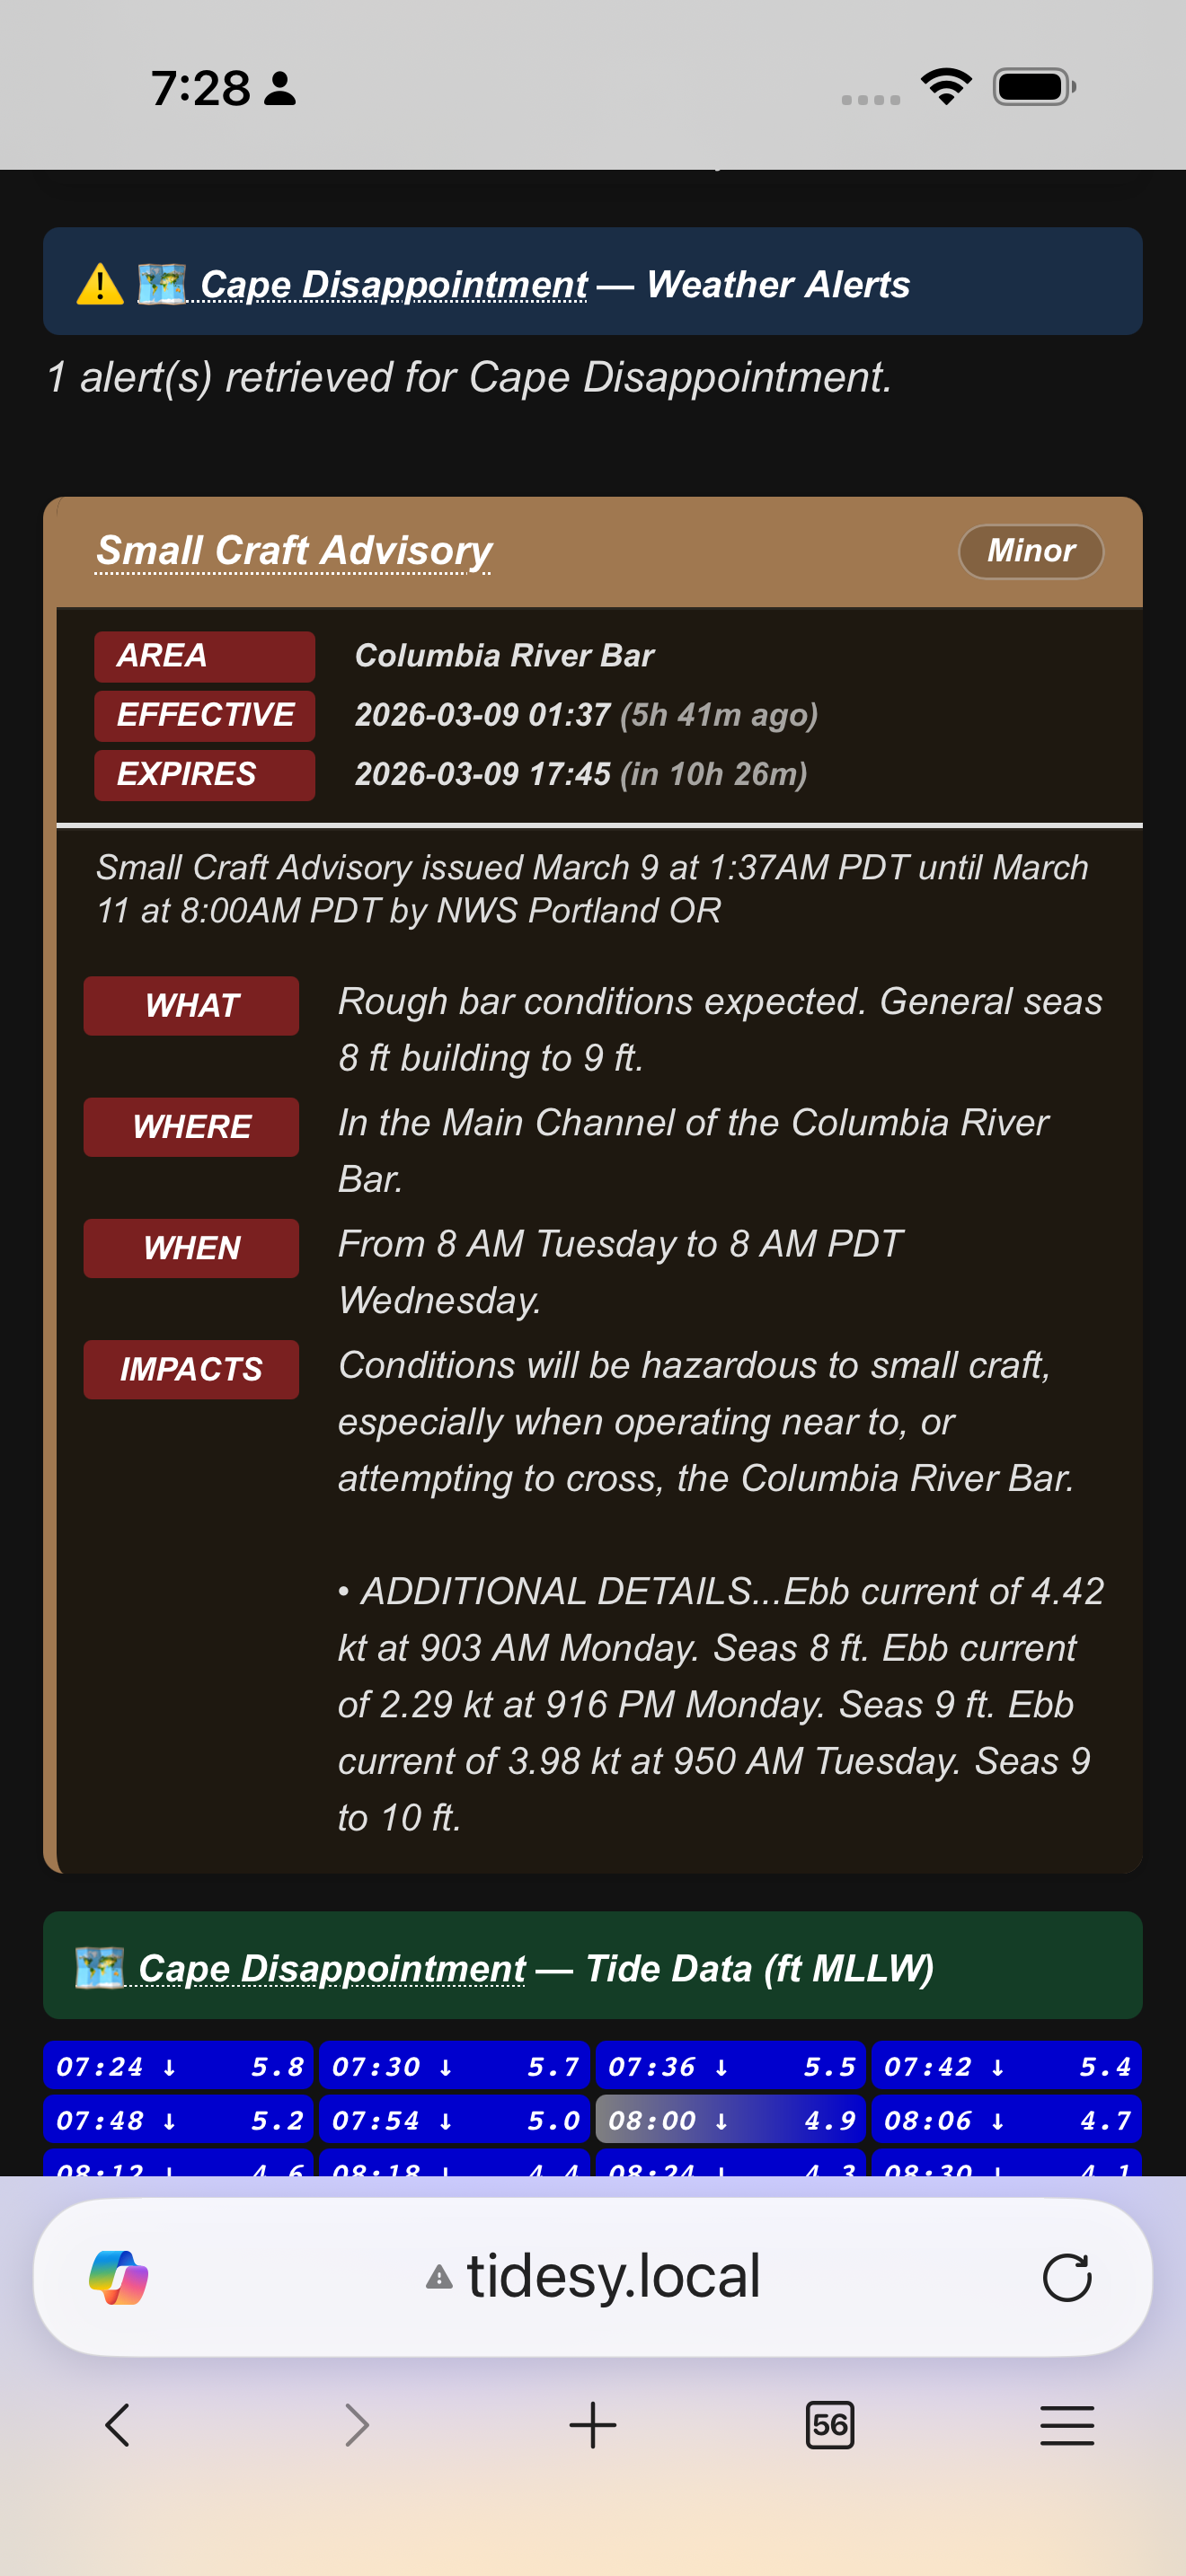
- Full-screen alert view: Shows station name, event heading, severity/area/effective/expires metadata displayed as severity-colored pill badges, and a description parsed into WHAT/WHERE/WHEN/IMPACTS sections (also shown as colored pills).
 1
2
3
4
5
6
7
8
9
1
2
3
4
5
6
7
8
9
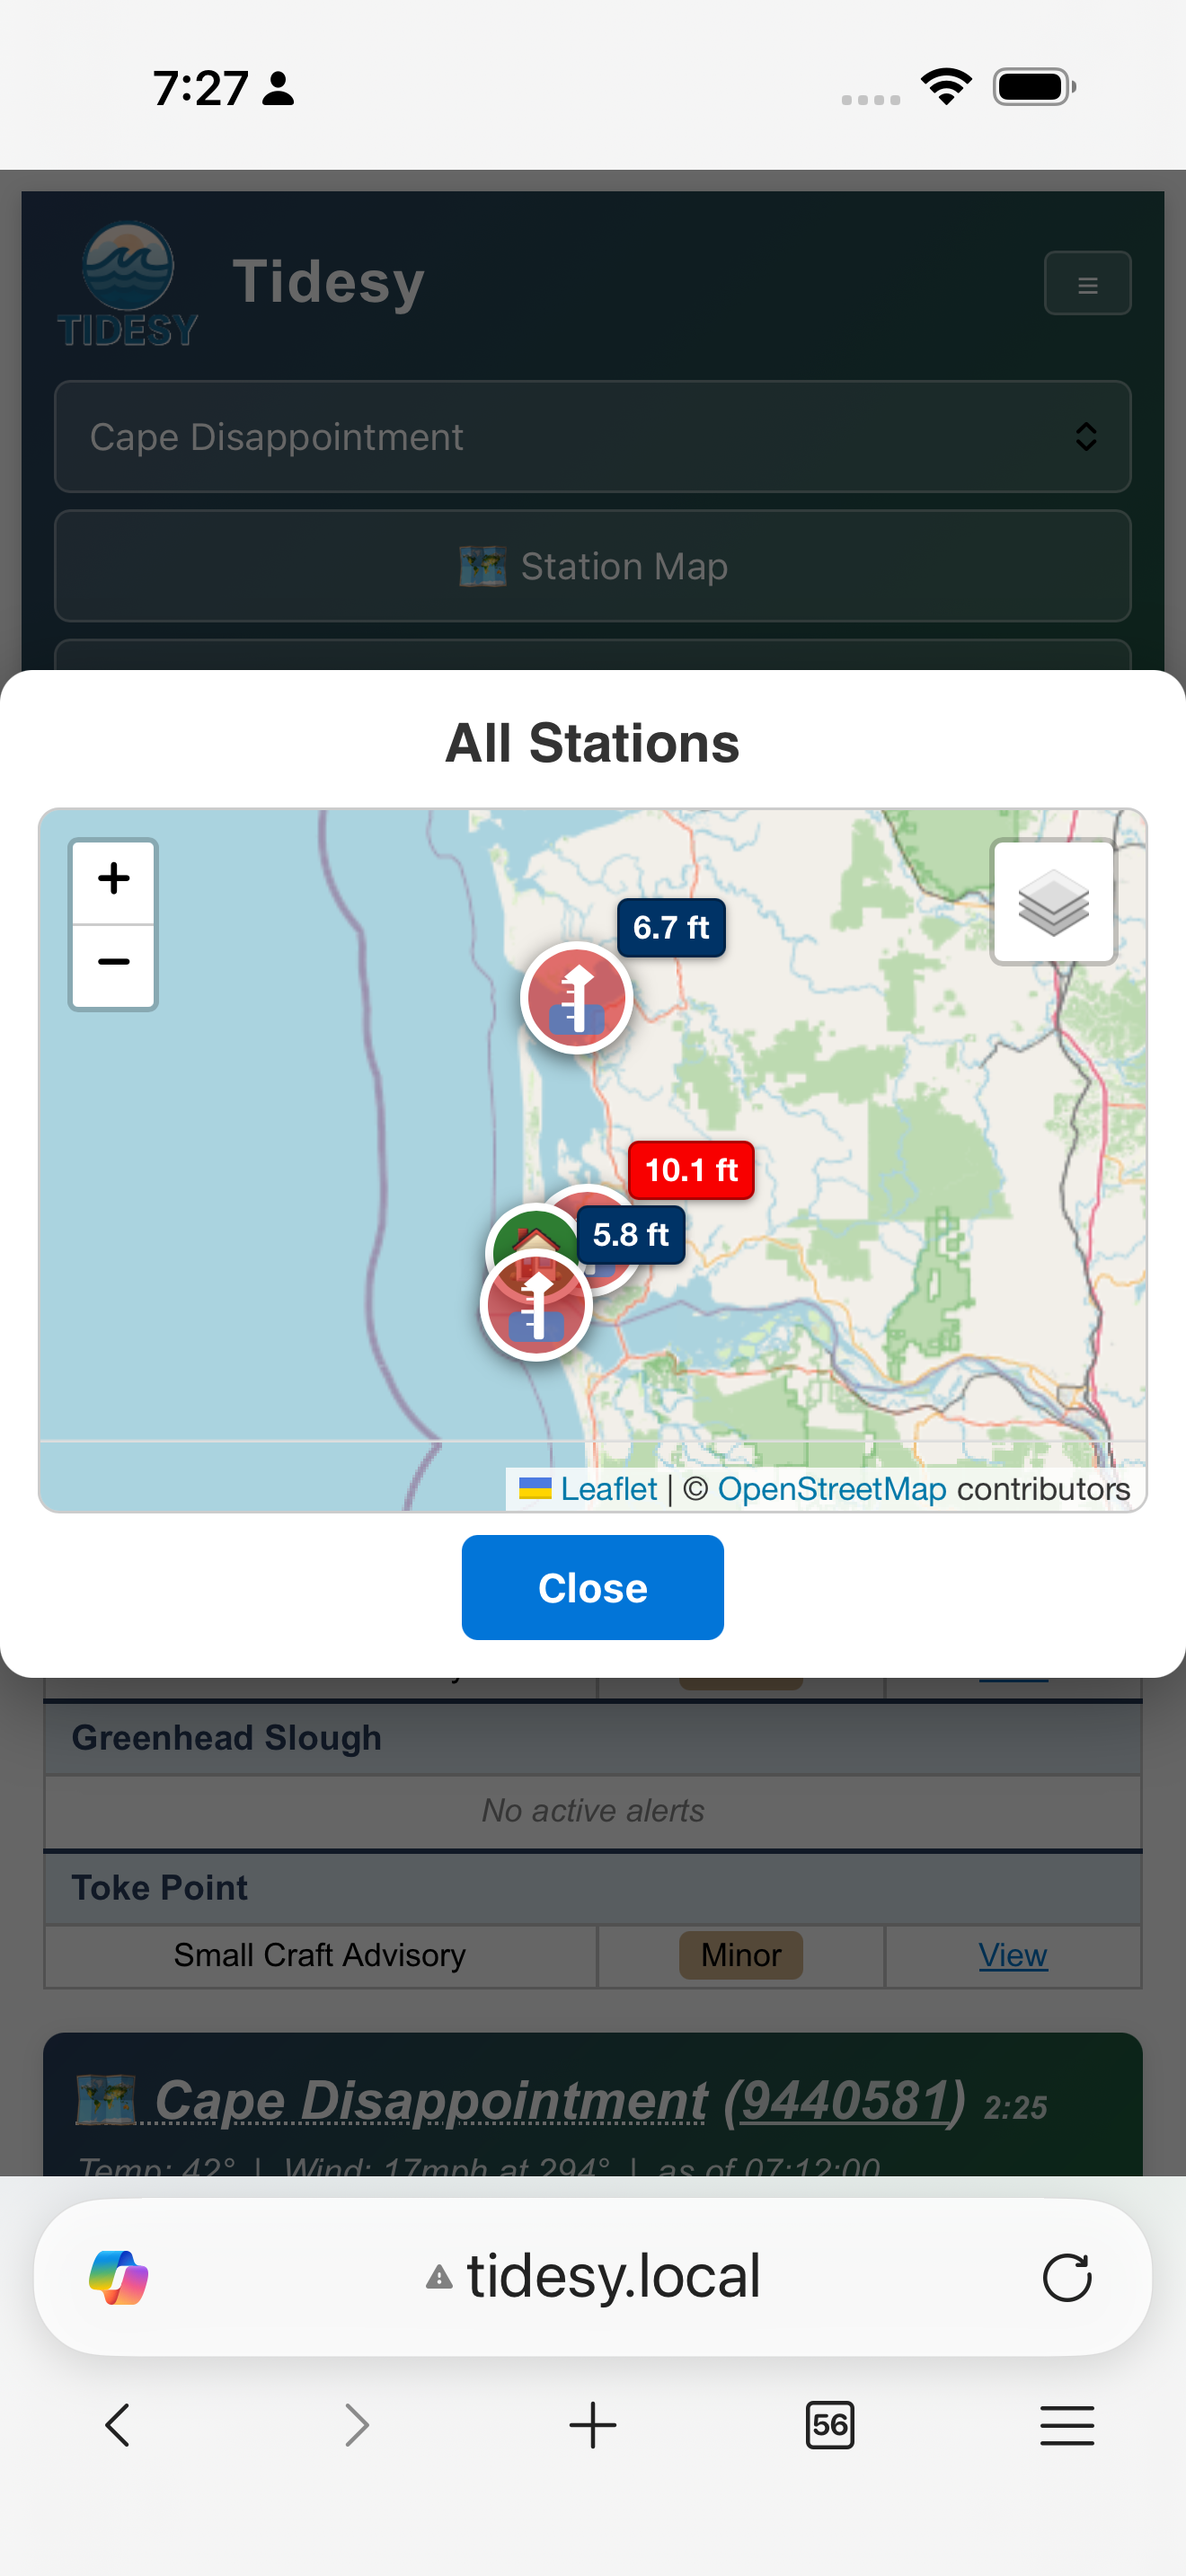
Alert Area Map
NWS alerts include a polygon defining the affected geographic area. The device itself doesn’t render the polygon — the on-screen alert view is text-only (event name, severity, area, effective / expires, WHAT / WHERE / WHEN / IMPACTS) so it stays legible at a glance. To see the polygon, open the web dashboard: its alert detail card draws the affected area at full resolution alongside your configured stations, so you can see exactly how much of the surrounding region is covered and where you sit relative to the warning zone.
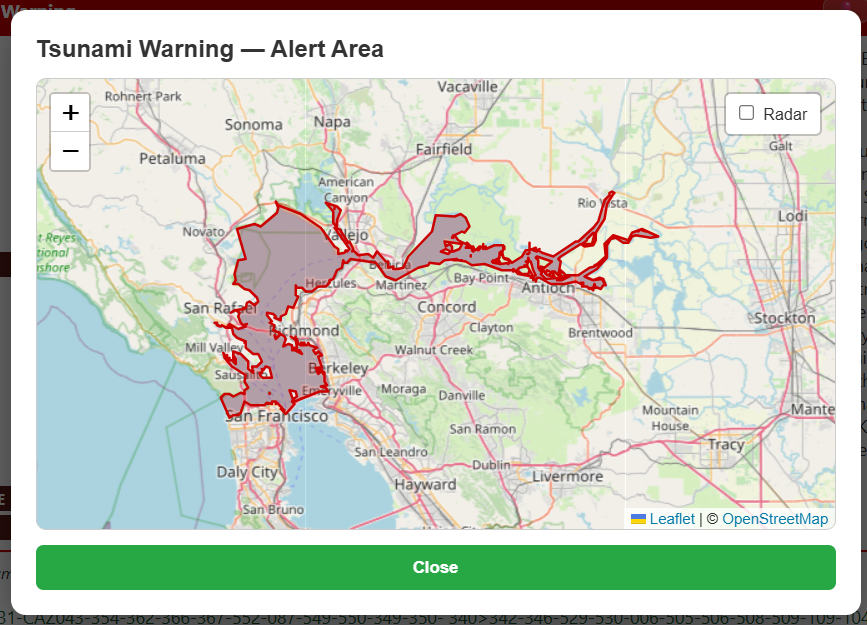
The polygon is drawn directly from the NWS alert payload. Your configured stations are pinned on the same map so the geographic relationship is obvious.
Alert Display on Web Dashboard
The web dashboard shows alerts as styled cards with color-coded left borders matching the severity level. Tap or click an alert event name to see a popup with the NWS definition explaining what that alert type means.
Common Alert Types
Alerts most relevant to Tidesy users include:
- Coastal Flood Advisory / Warning
- High Surf Advisory / Warning
- Rip Current Statement
- Small Craft Advisory
- Tsunami Watch / Warning
- Winter Storm Warning
- Hurricane Watch / Warning
- Beach Hazards Statement
- Dense Fog Advisory
- Gale Warning
7. Web Dashboard
Accessing the Dashboard
Open a web browser on any device connected to the same WiFi network and navigate to:
http://tidesy.local, orhttp://<device-IP>(the IP address shown during setup, e.g.,http://192.168.1.42)
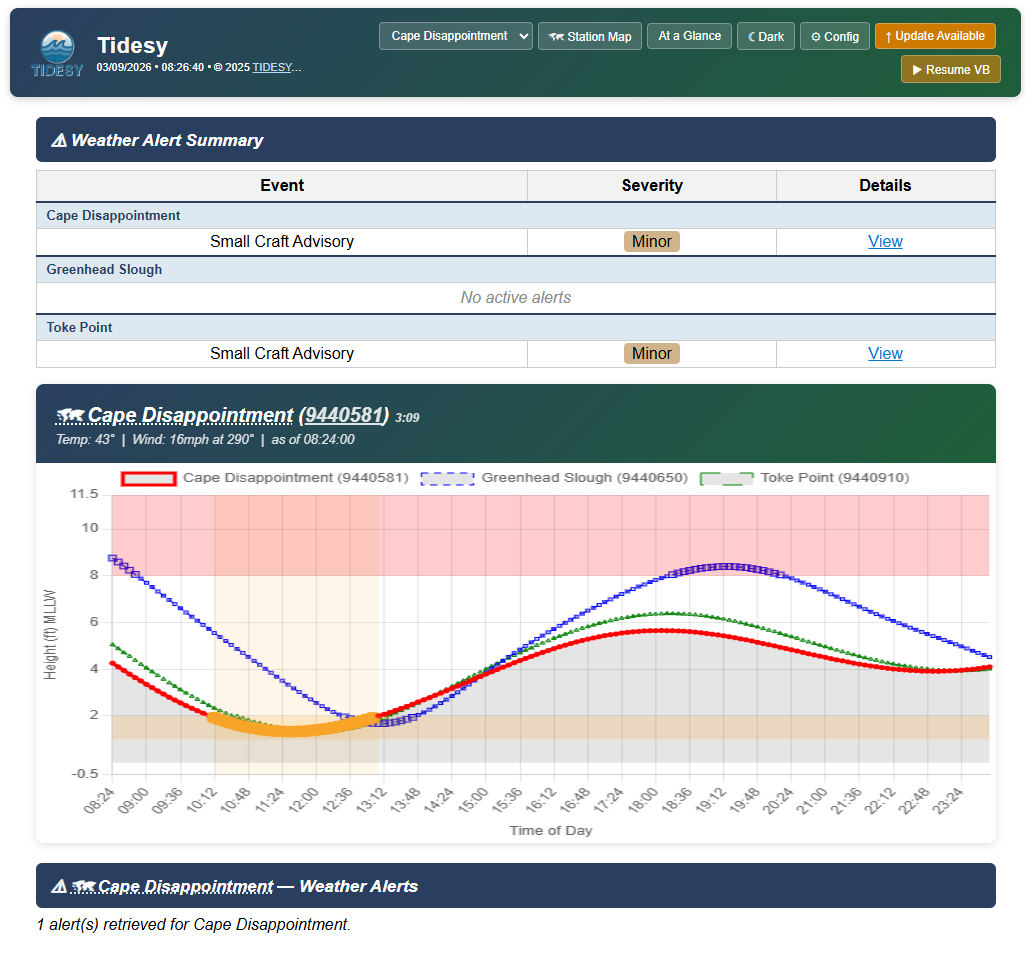
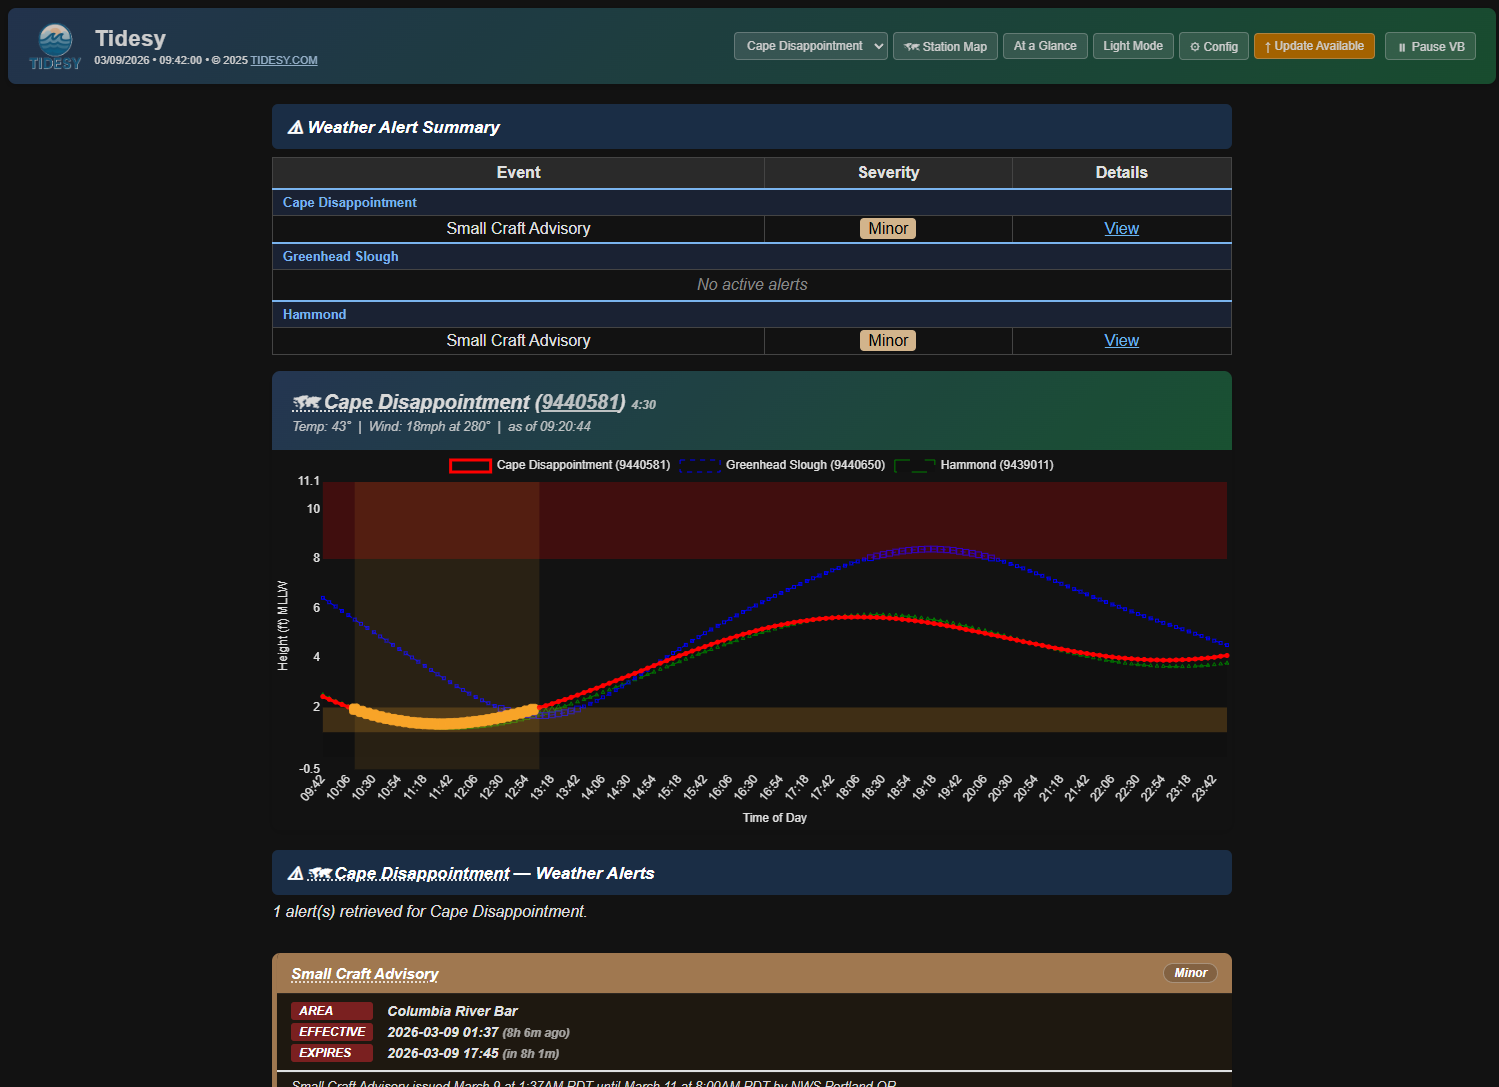
Dashboard Features
- Station cards: Each configured station has a card showing current tide data, next high/low, and weather. The NOAA station ID in the header is a link to the station’s page on the NOAA Tides & Currents website.
- Live update countdown: Timer shows when the next data refresh will occur.
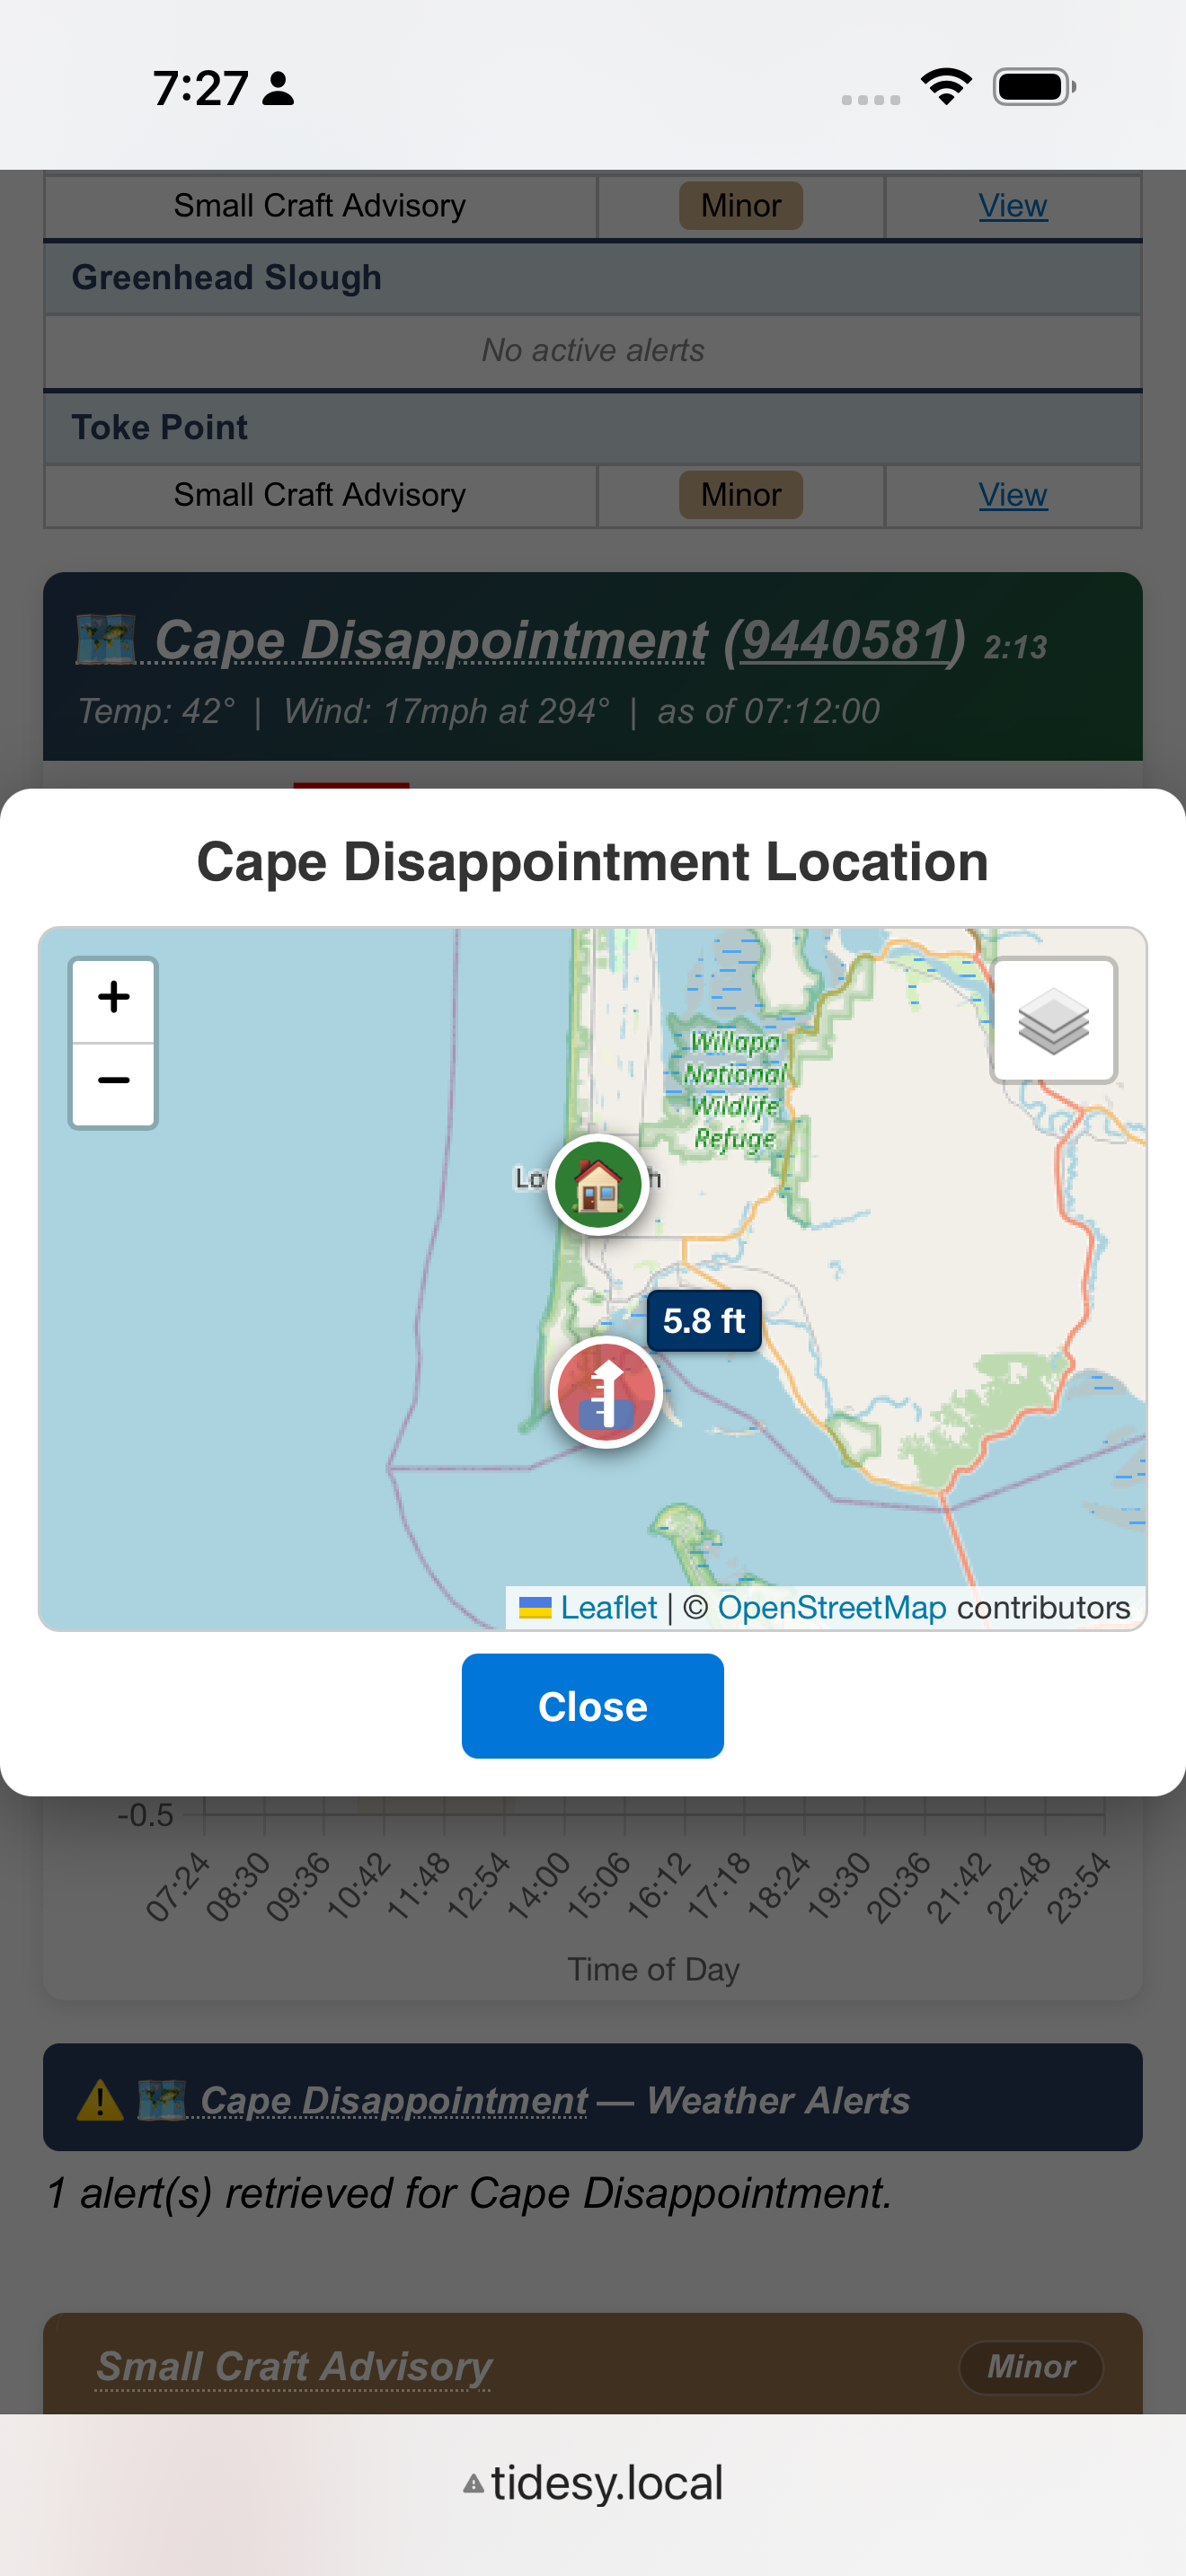
- Interactive map: Leaflet/OpenStreetMap map with station markers (blue) and home location marker (green house icon). Click a station name to focus the map.
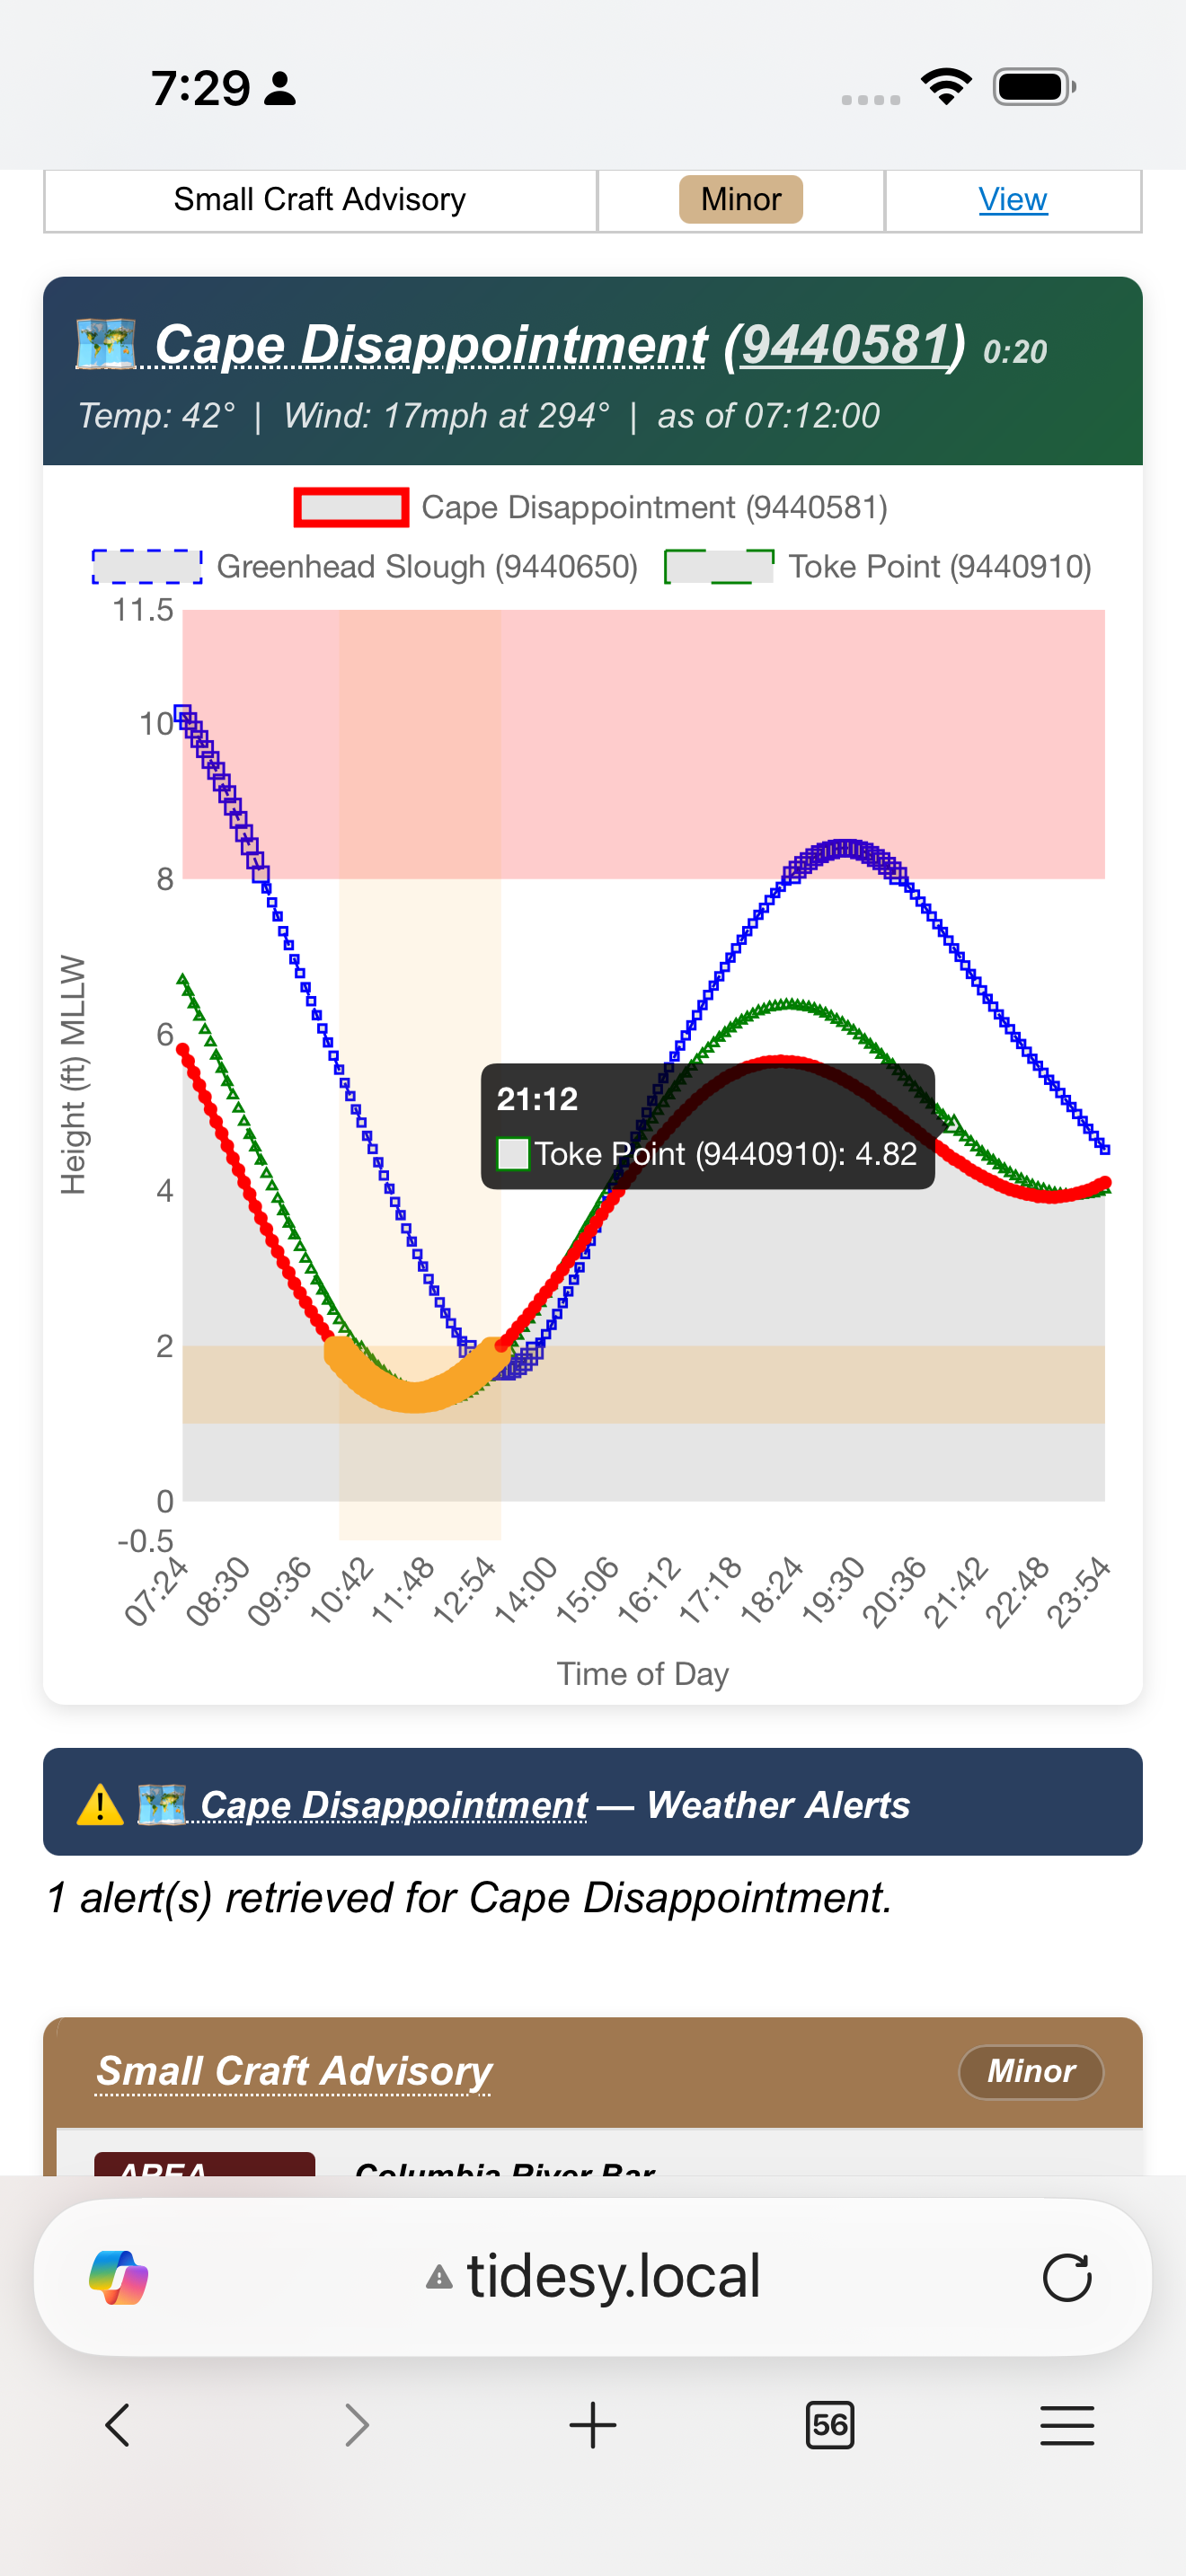
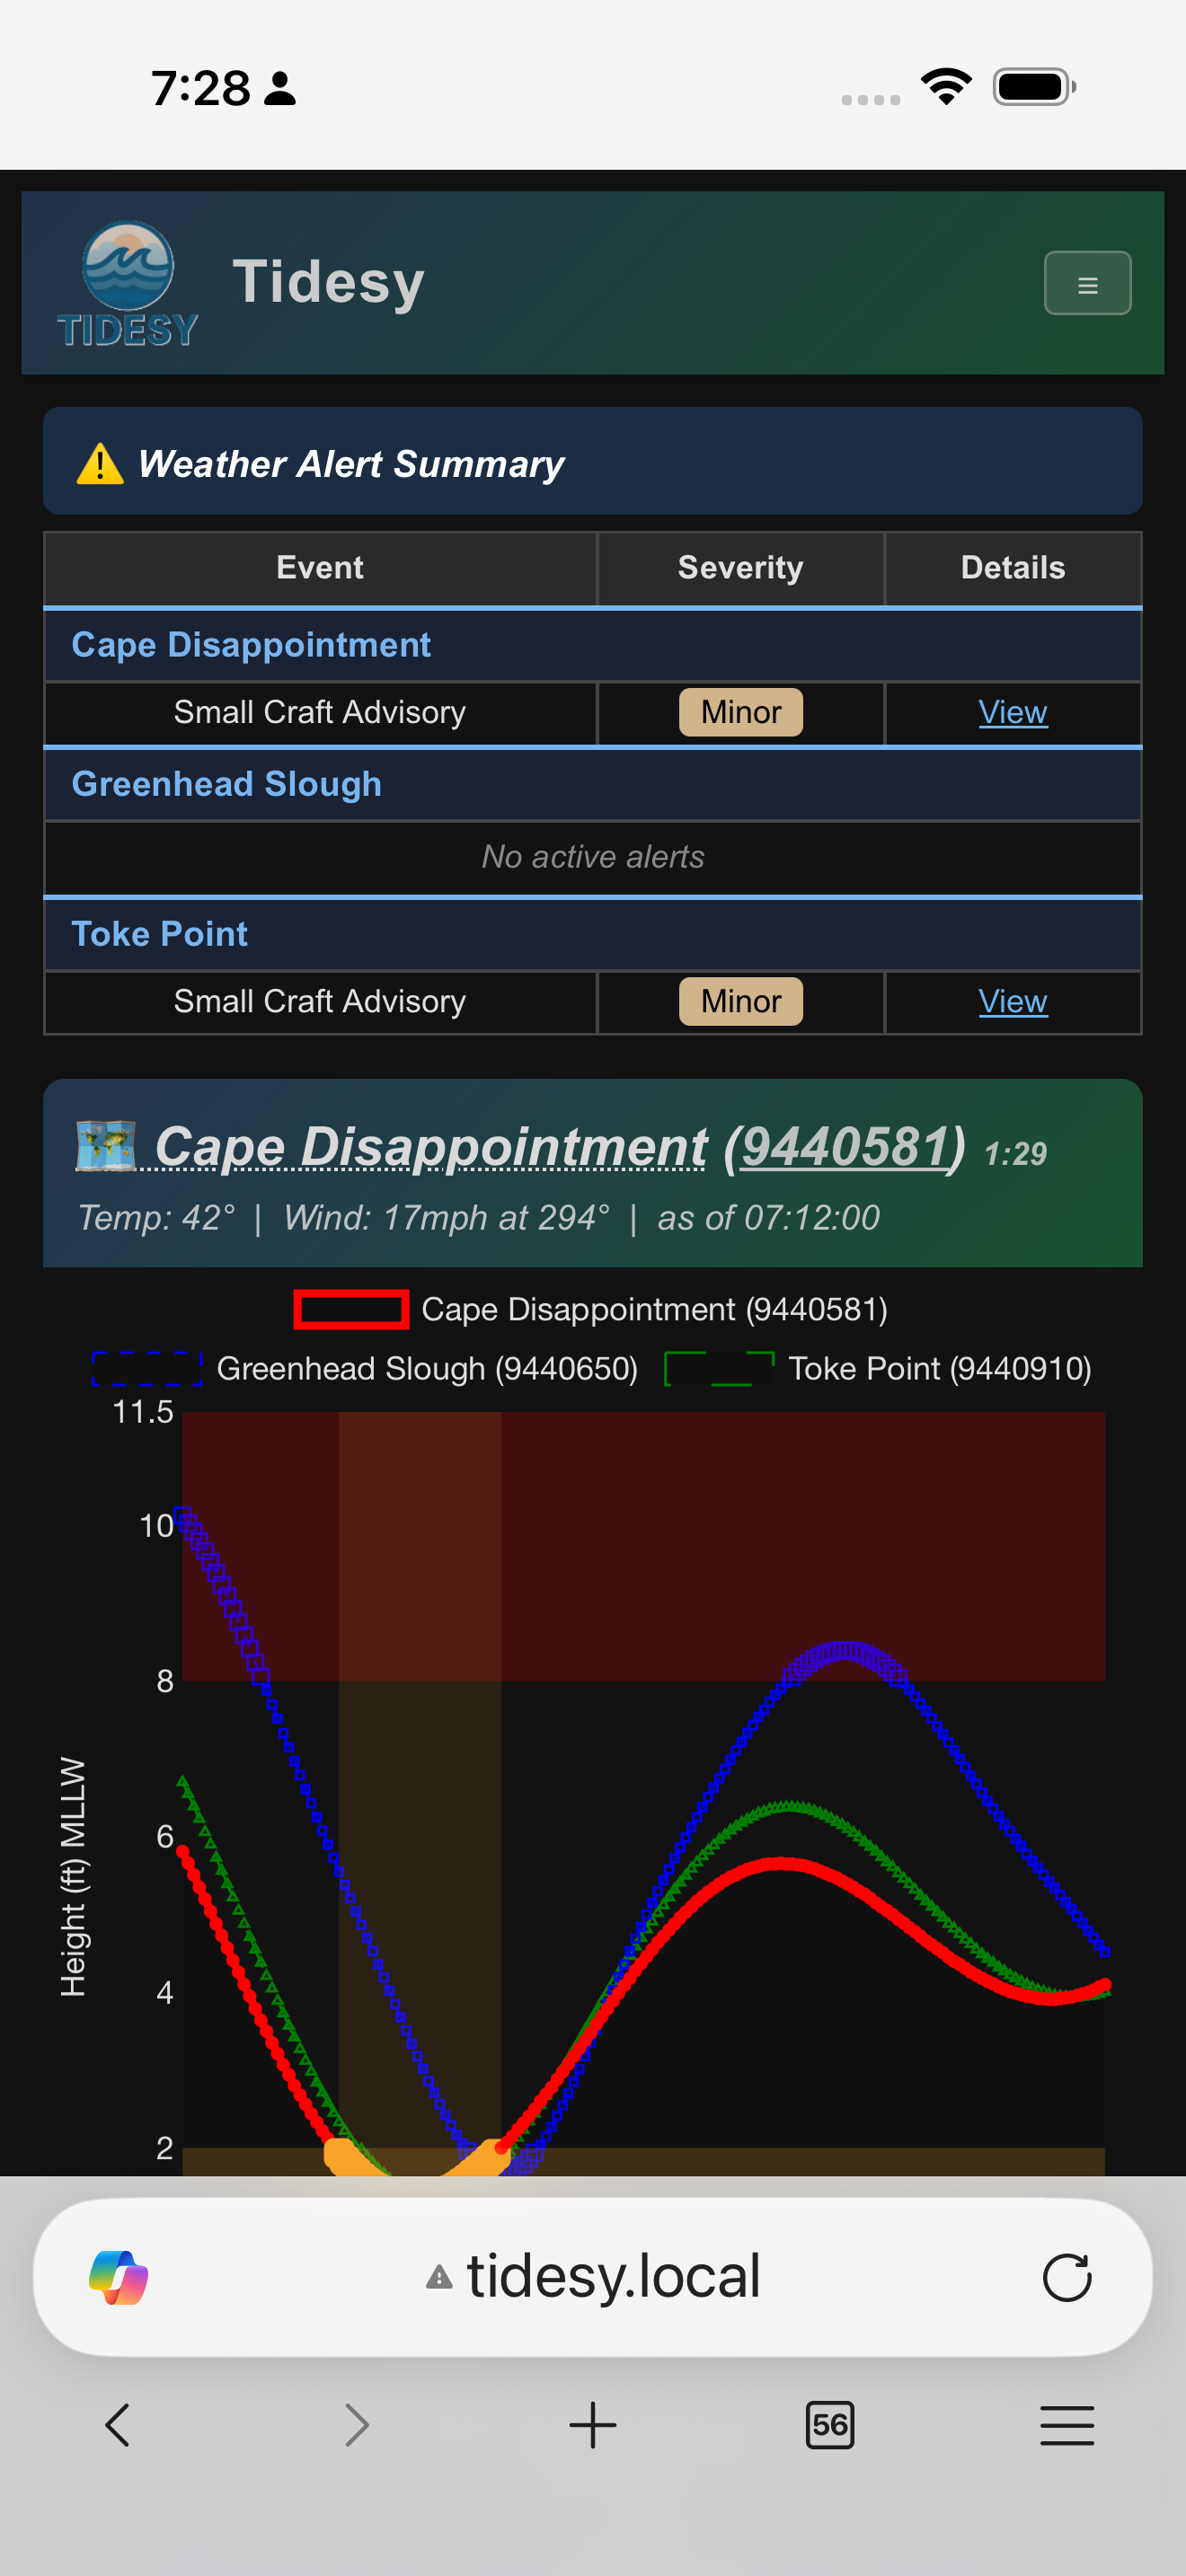
- Tide curve graphs: Chart.js-rendered 24-hour tide curves for each station with interactive tooltips.
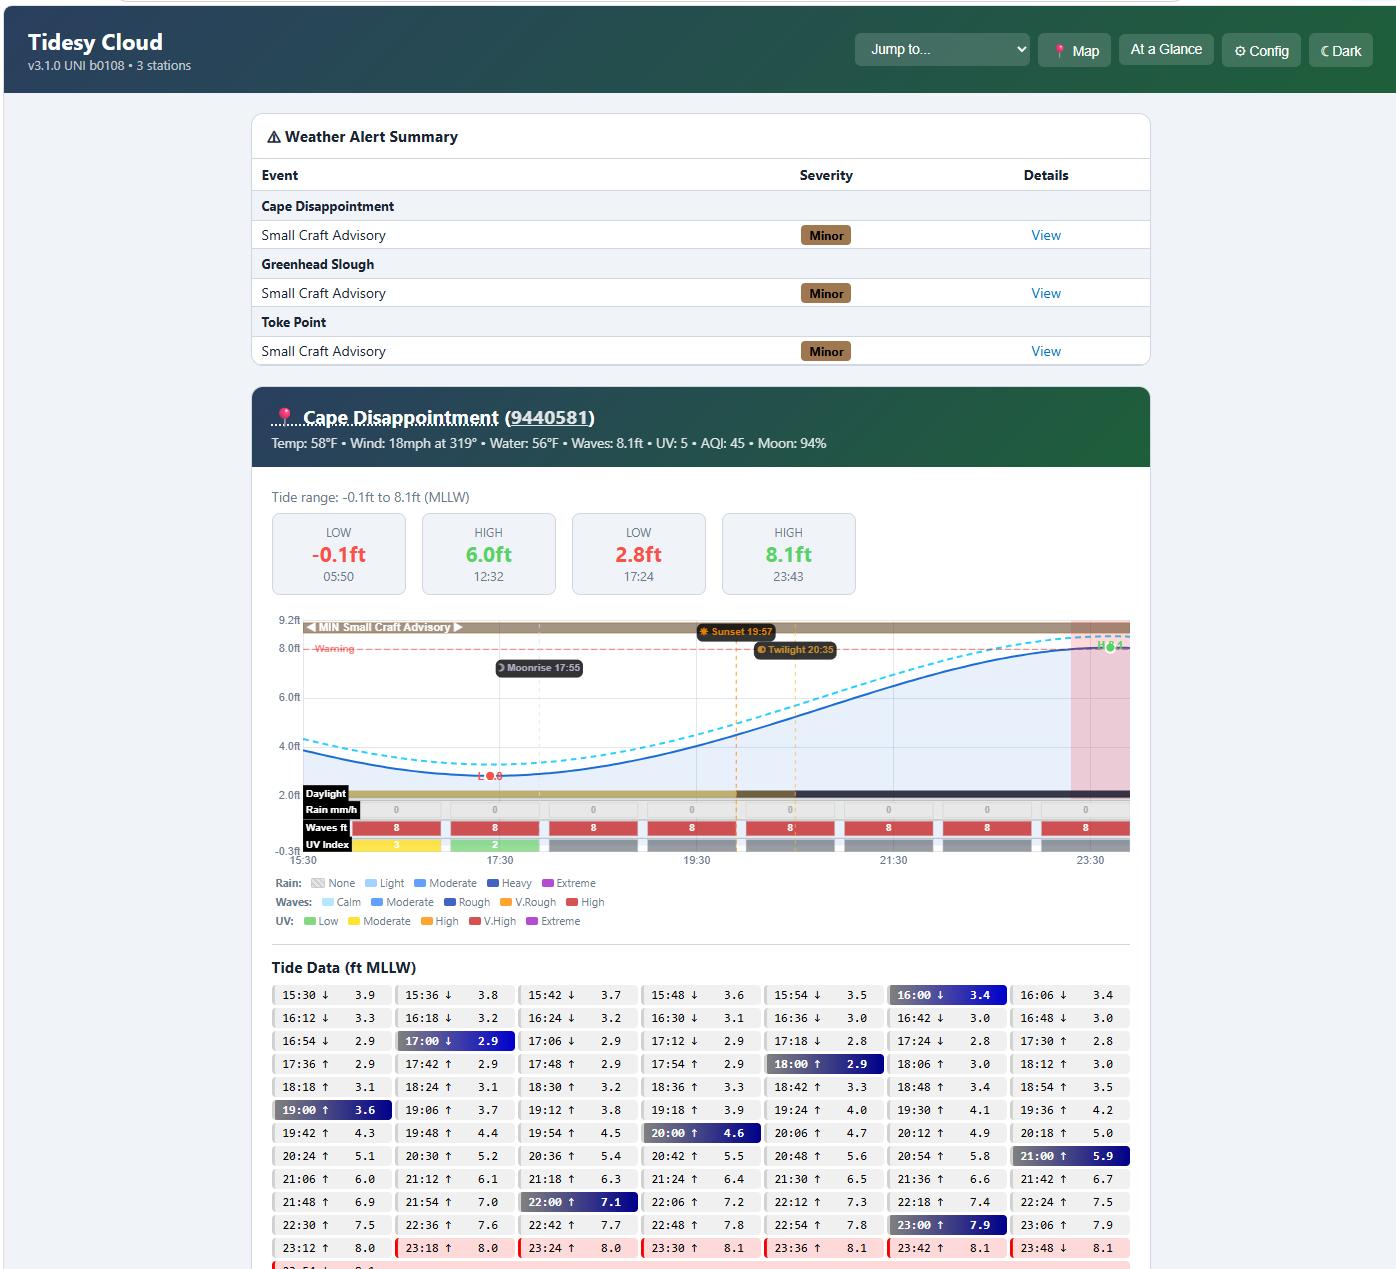
- Alert summary cards: Active NWS alerts displayed as color-coded cards (see Section 6). Tap an alert event name to see a popup with the NWS definition of that alert type.
- Dark/light mode toggle: Switch between dark and light themes. Preference is saved.
- Home marker toggle: Show or hide your home location marker on the map.
- Responsive design: Optimized for phone, tablet, and desktop browsers.
 1
2
3
4
5
6
1
2
3
4
5
6
Scrolling down reveals alert detail cards and the tide data table:
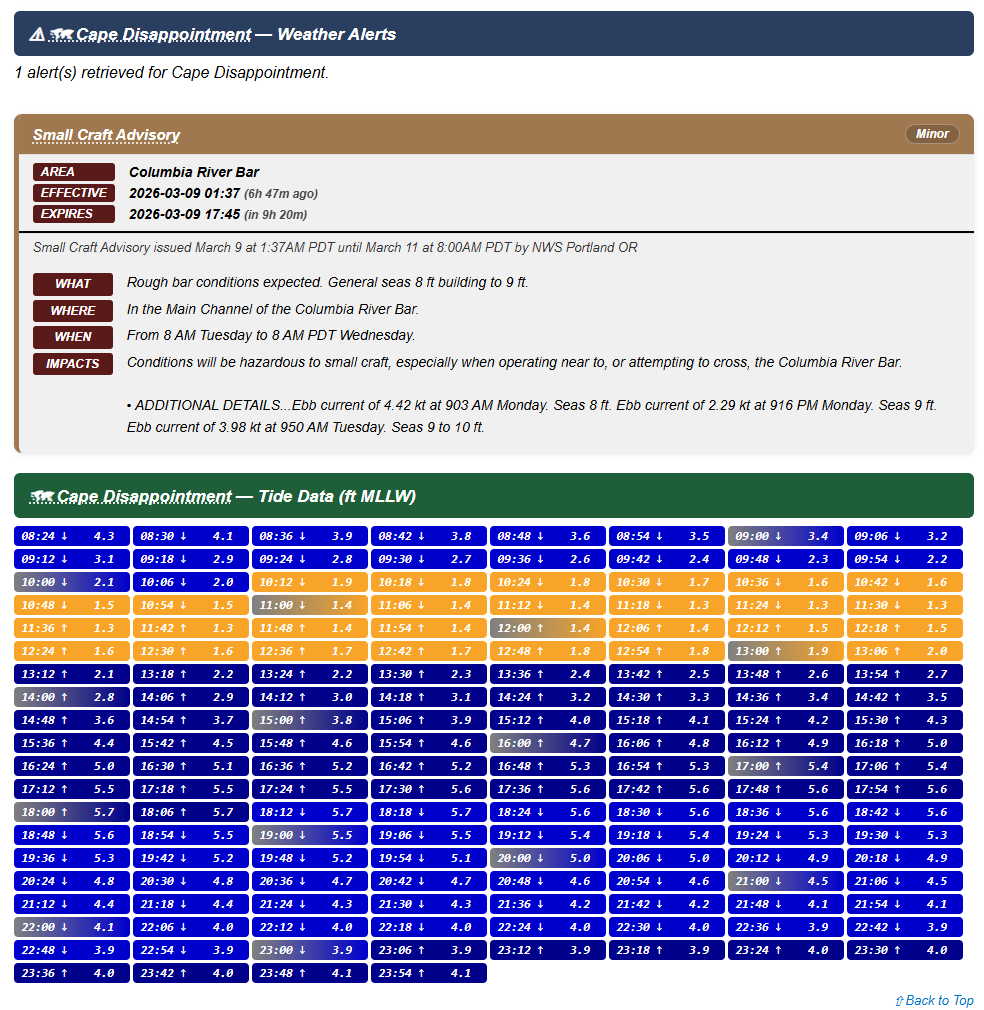
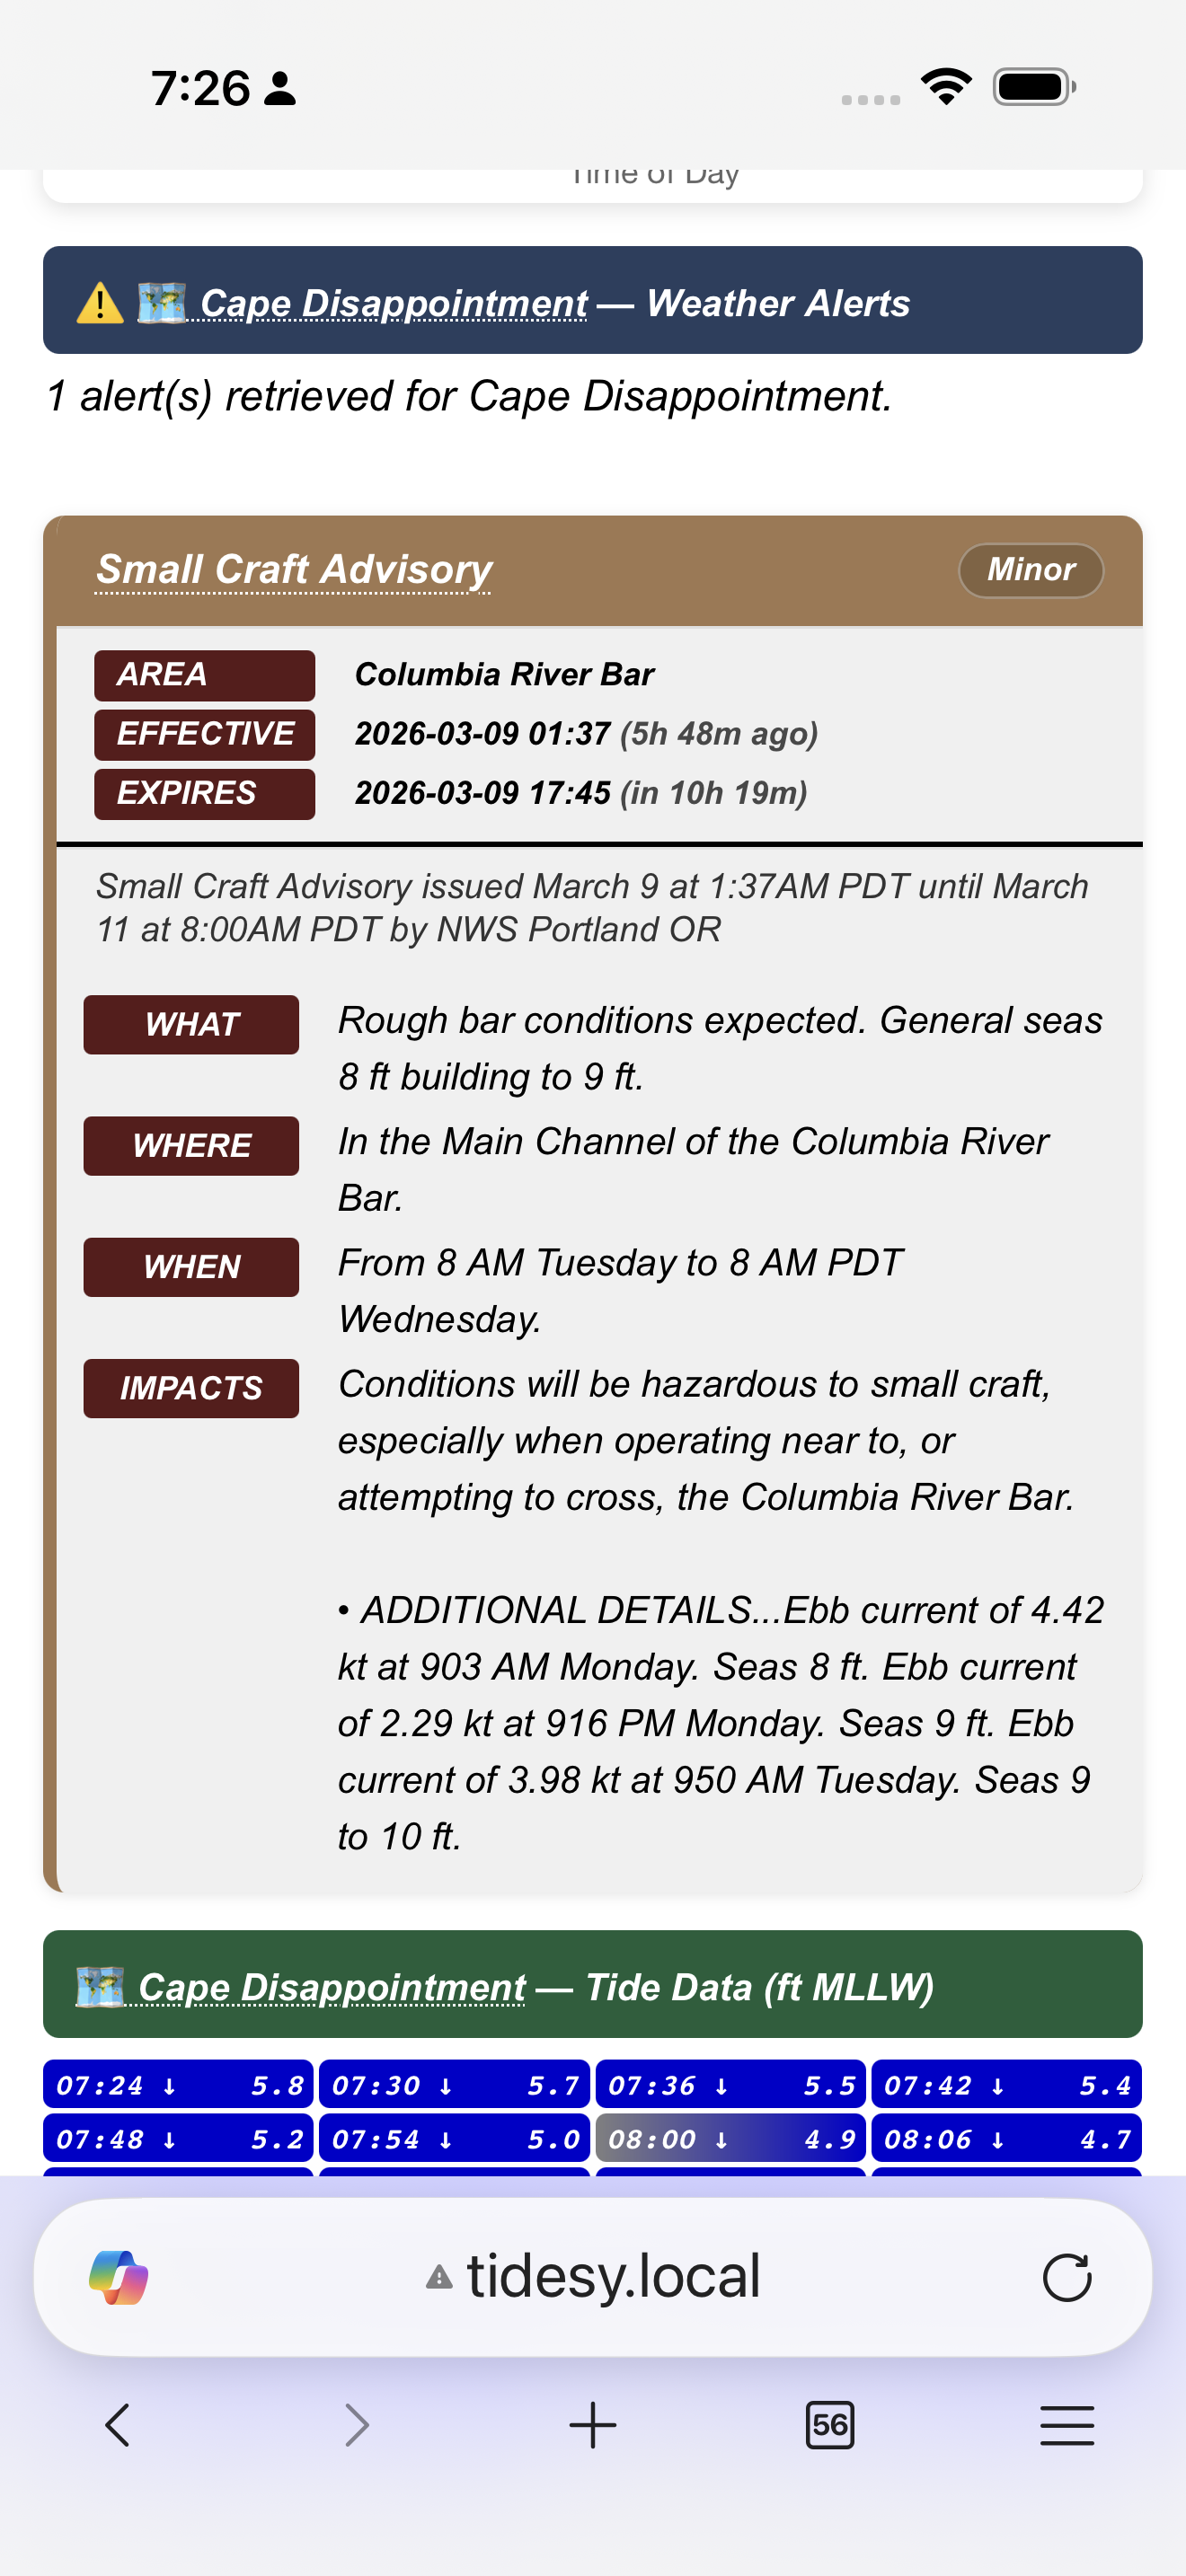
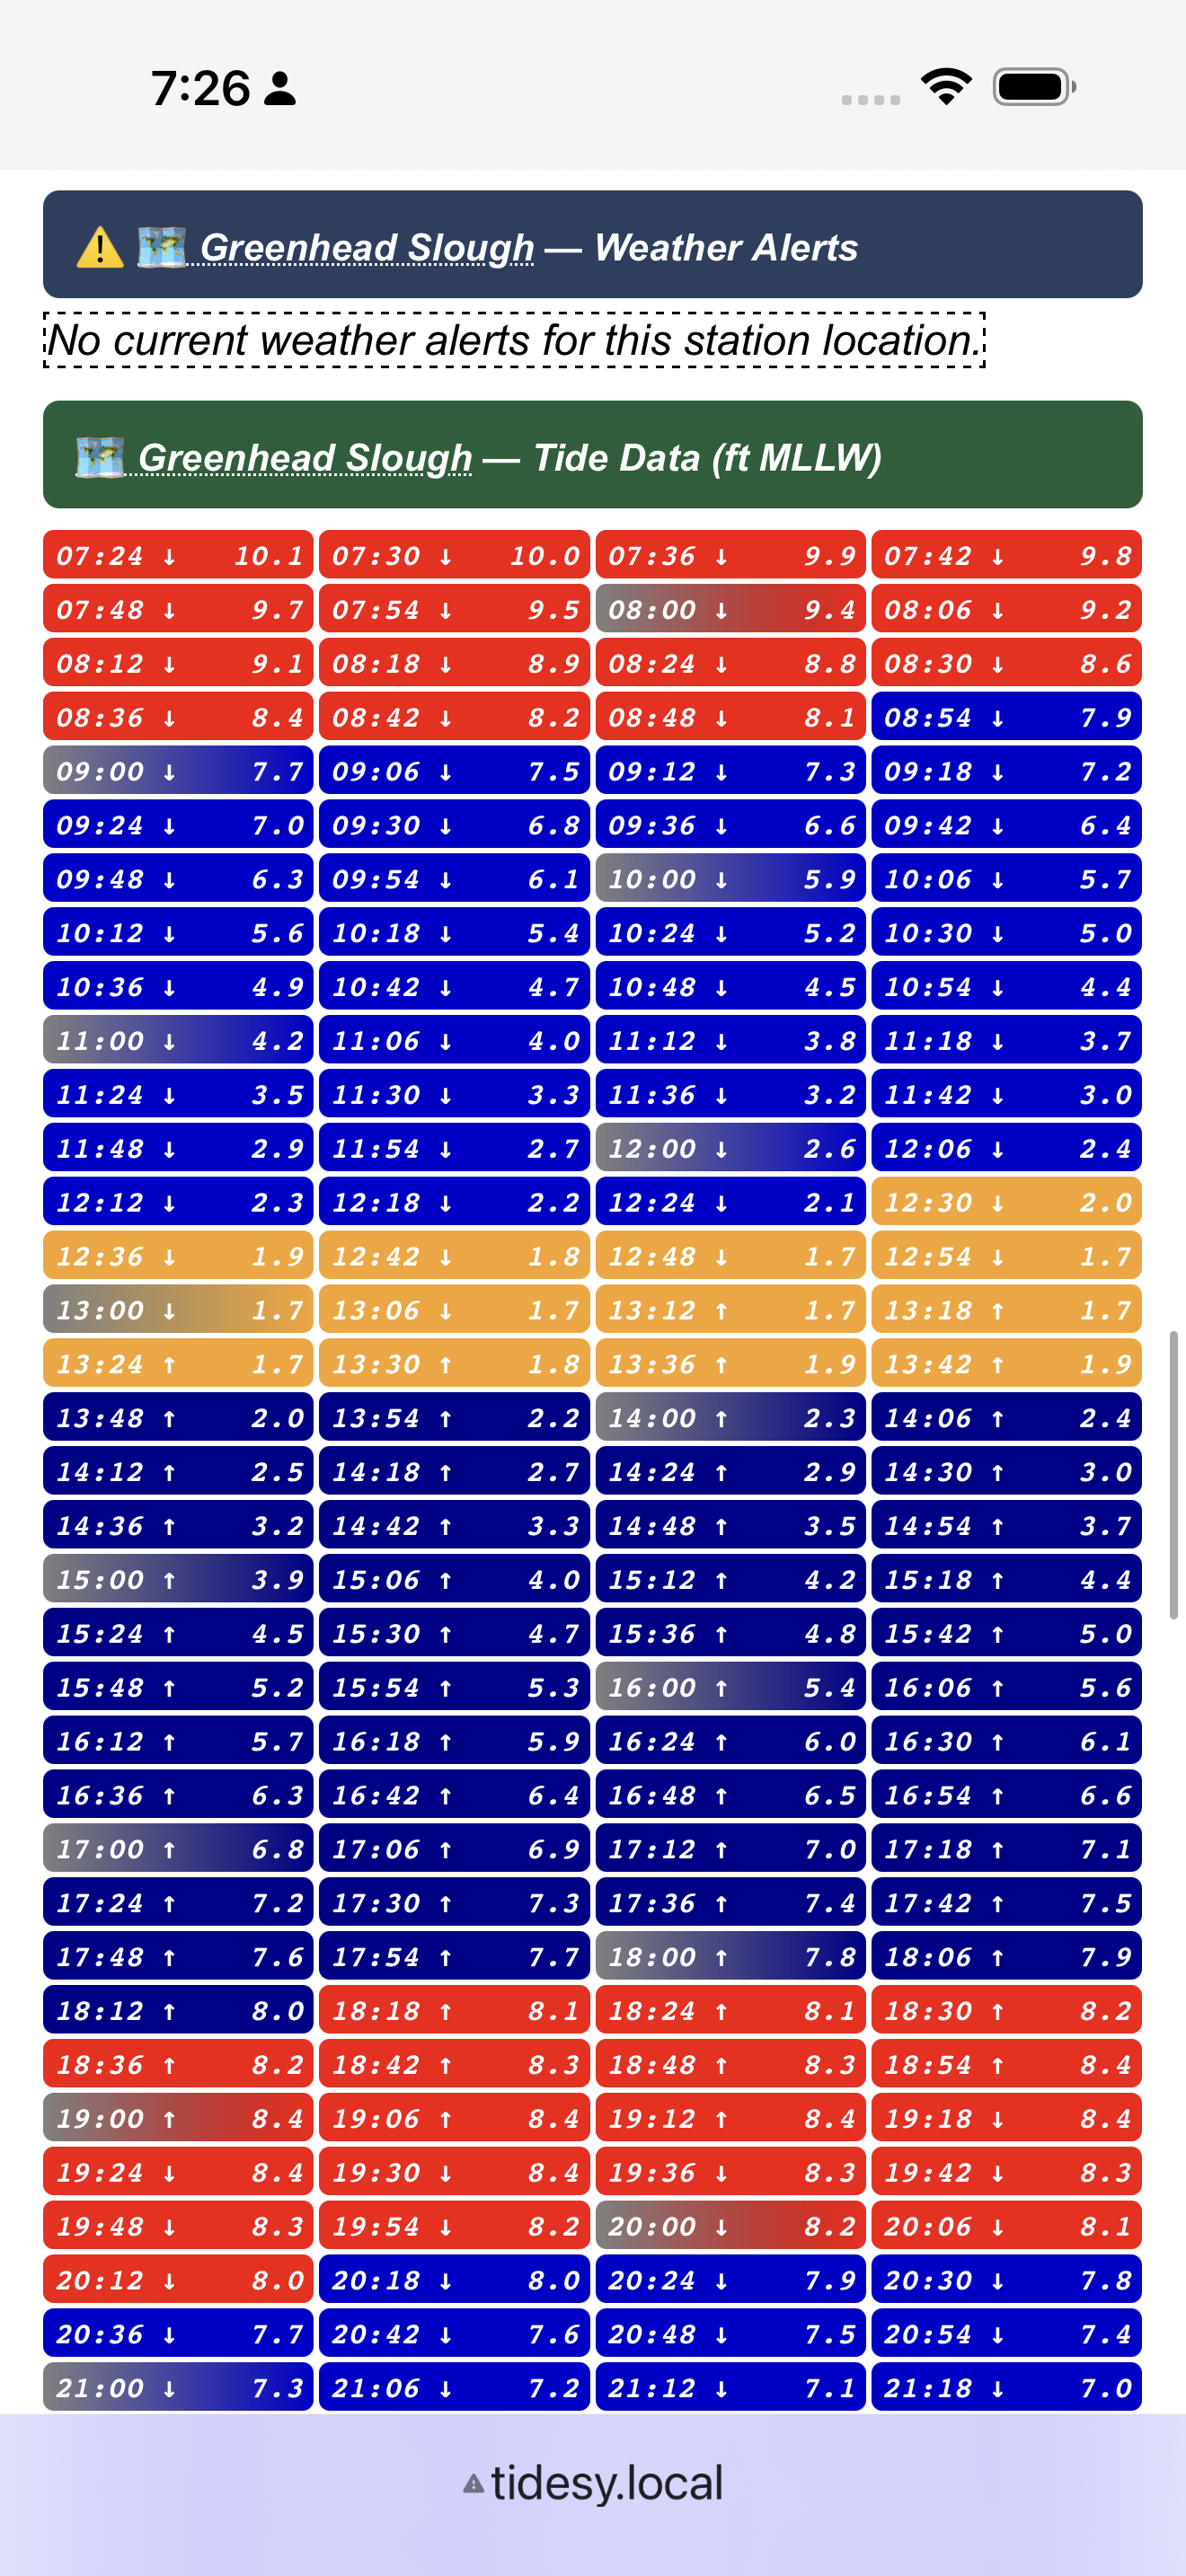
Alert card with AREA/EFFECTIVE/EXPIRES metadata, WHAT/WHERE/WHEN/IMPACTS sections, and a color-coded tide data table below.
Hover or tap a data point on the chart to see the exact time and tide value:
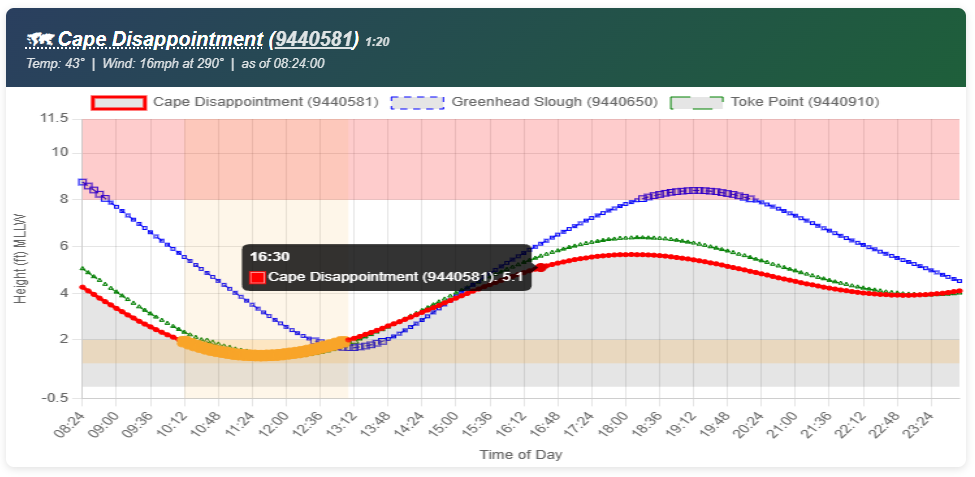
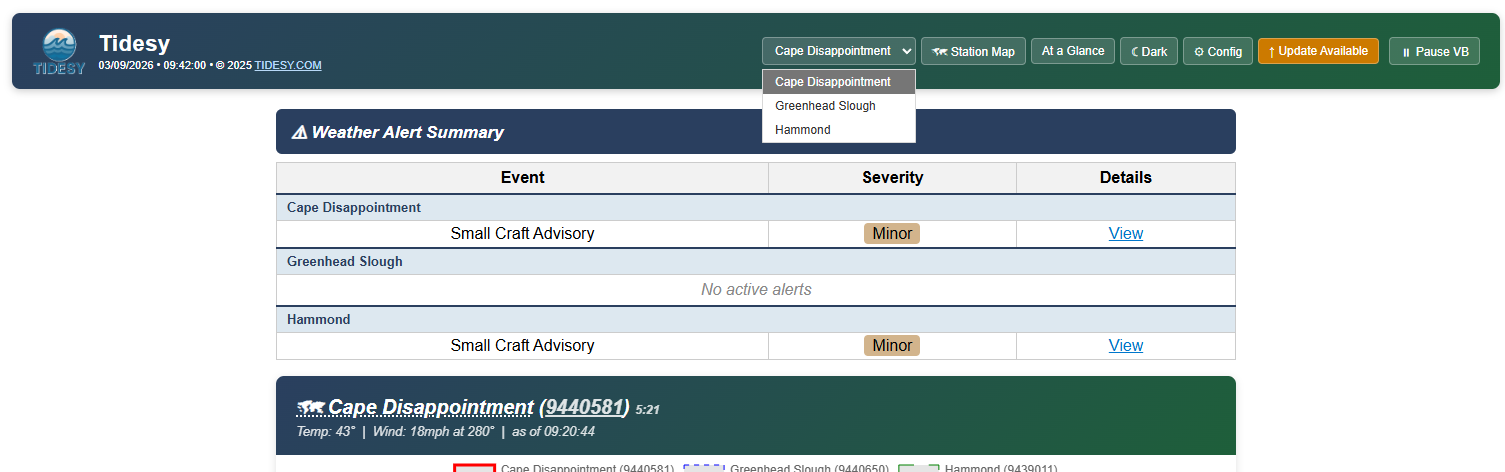
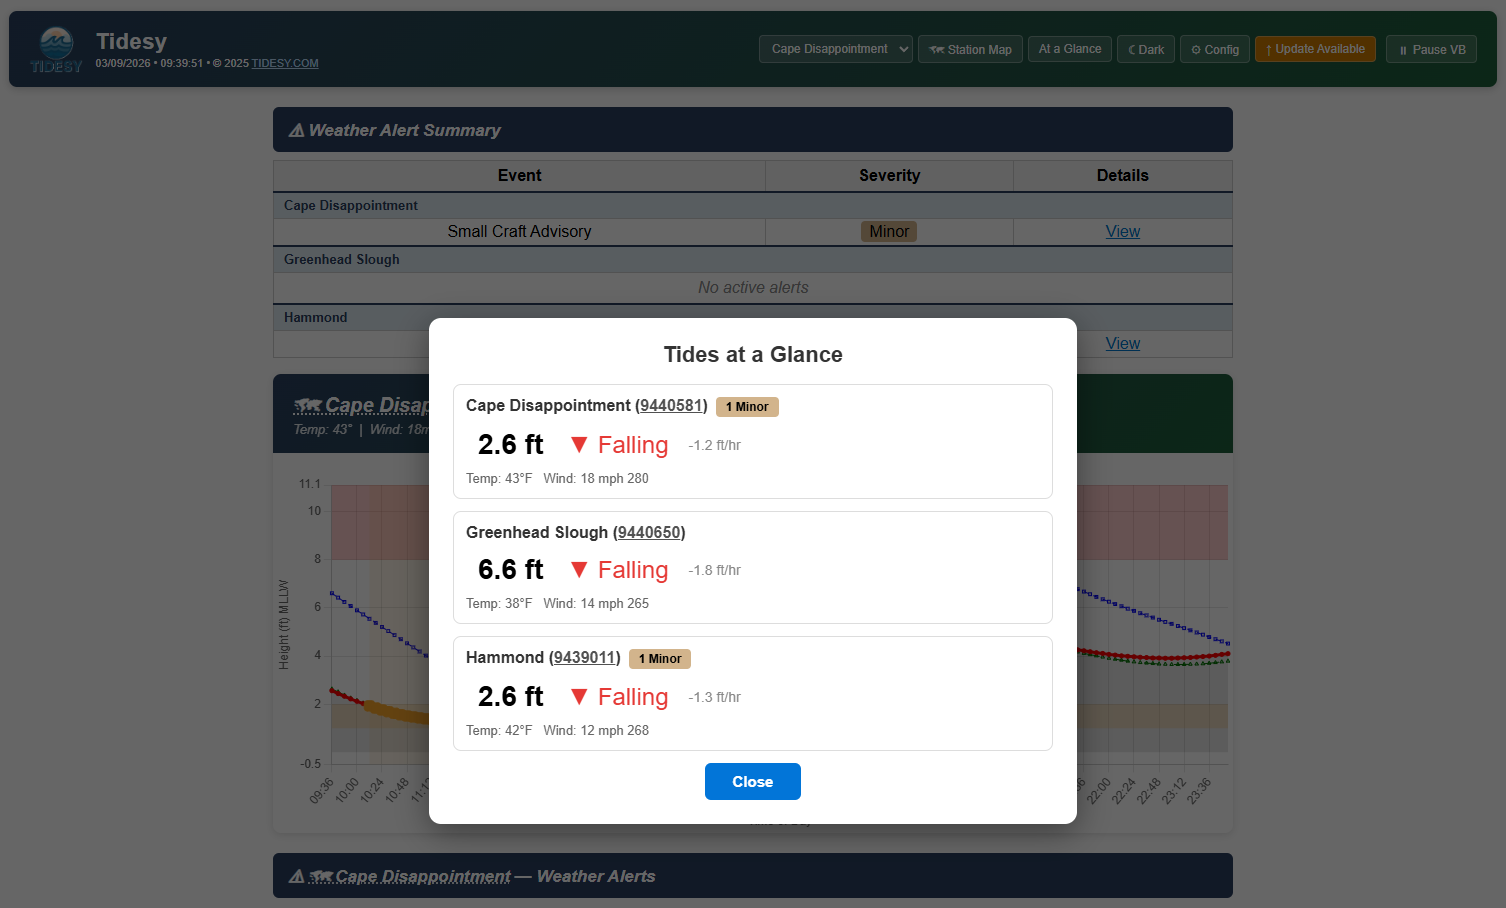
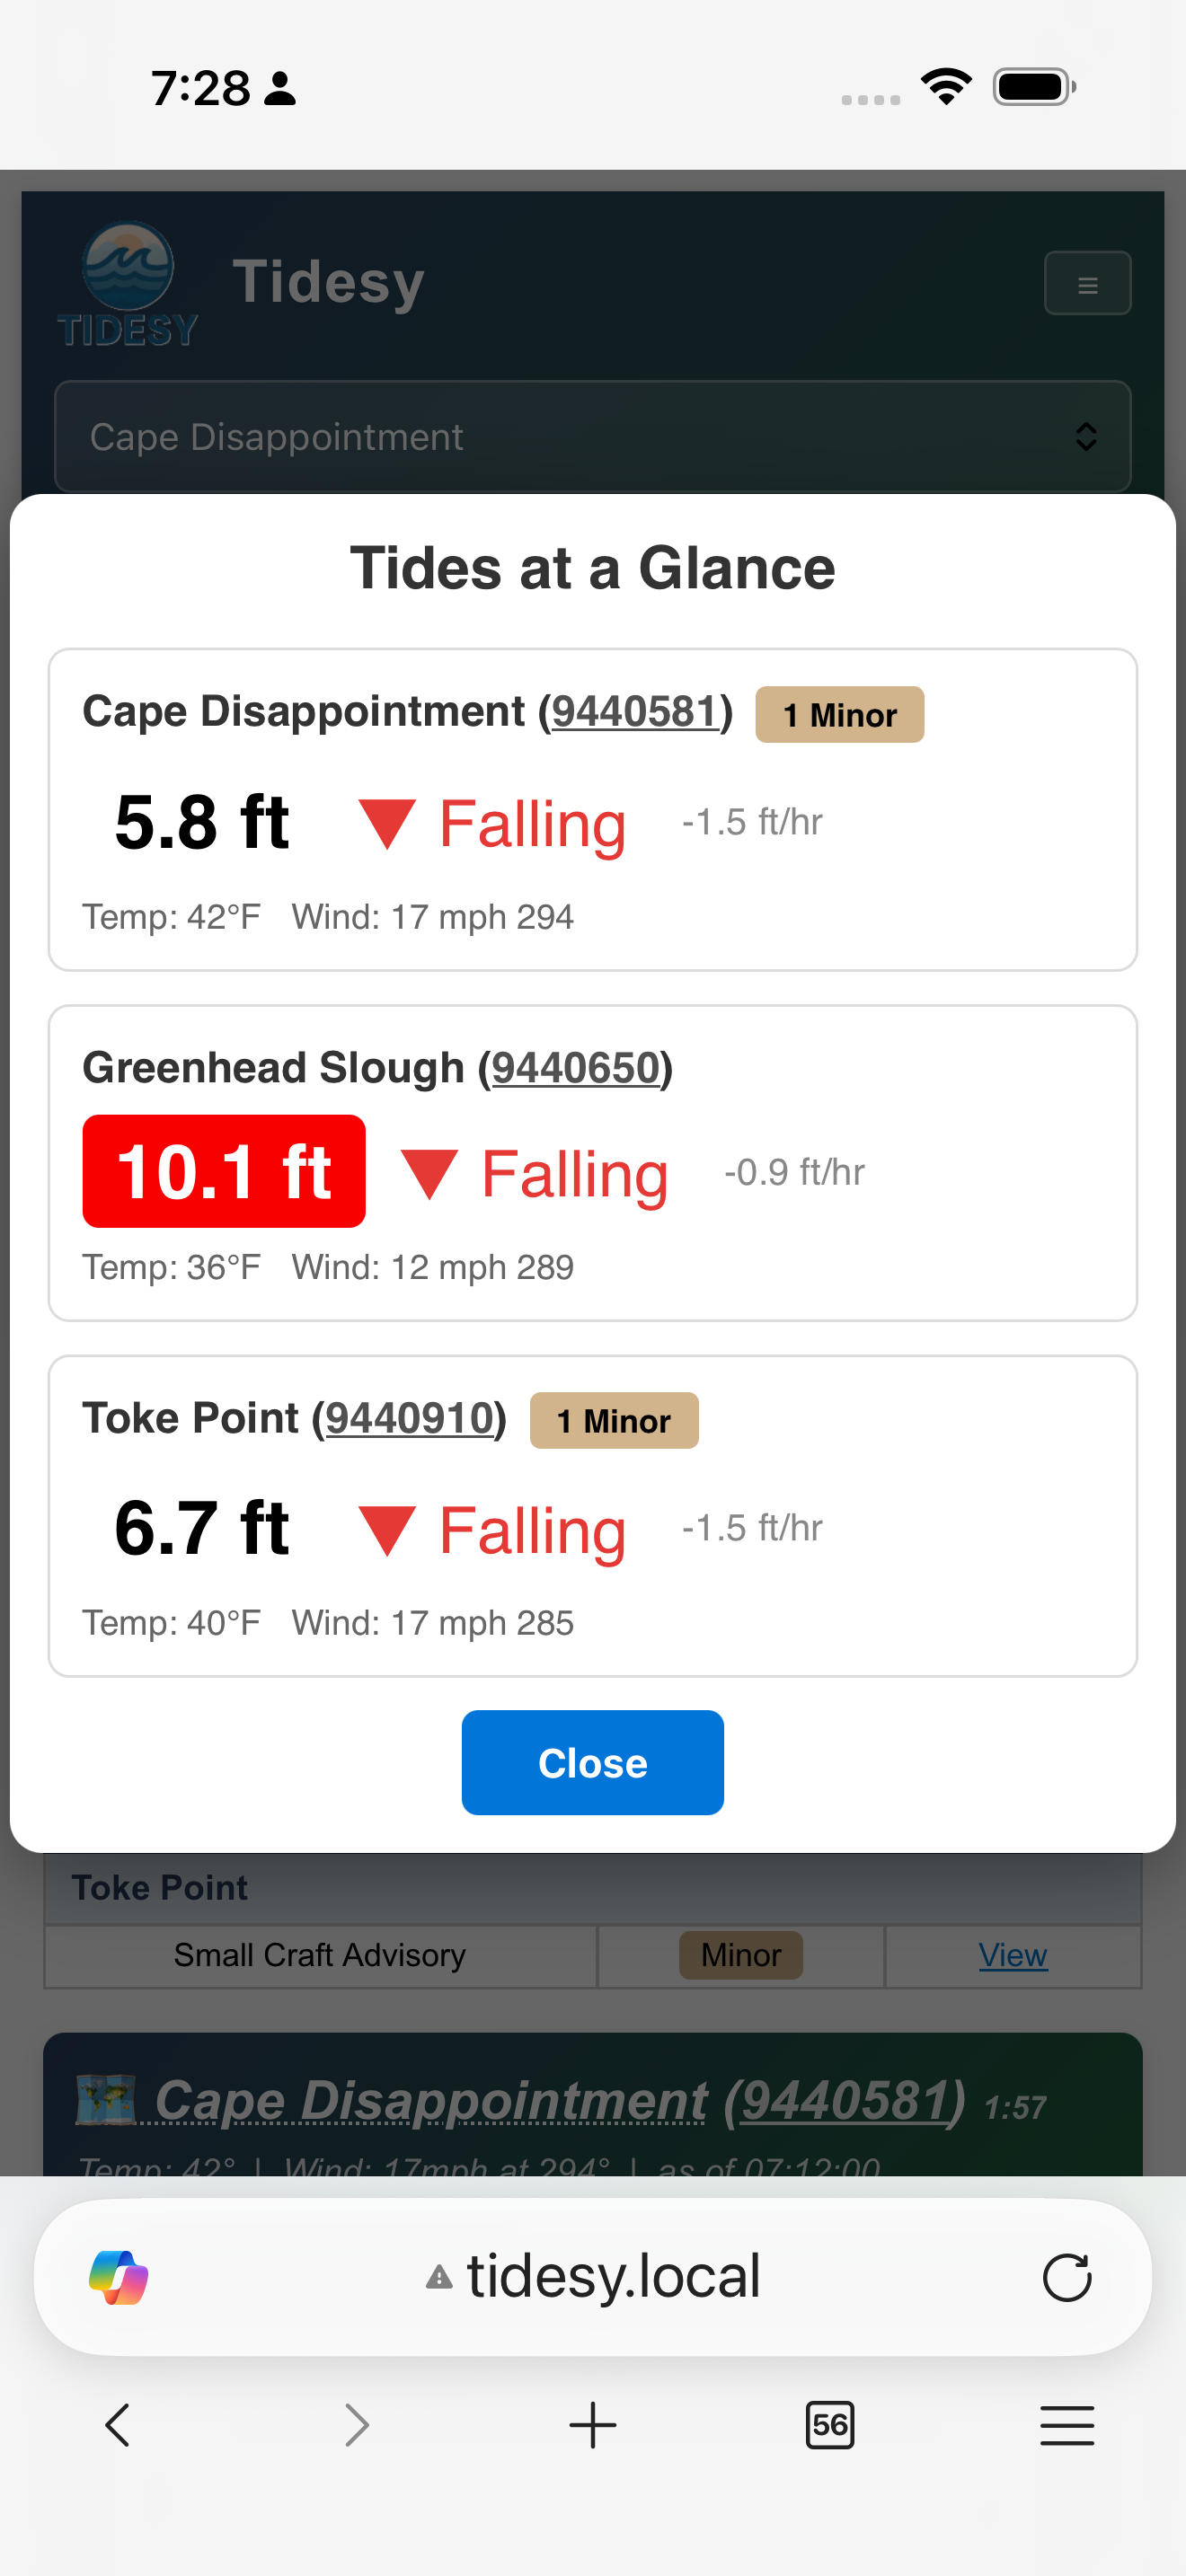
The station selector dropdown lets you jump to a specific station’s data, and the “At a Glance” popup shows all stations at once:
Dark Mode
Toggle dark mode using the button in the page header. The preference is saved in your browser and persists across visits. Dark mode adjusts backgrounds, text colors, card styles, and map tile contrast.
Dark mode with alert summary, tide chart, and alert detail cards.
Map
The interactive map shows:
- Station markers (blue pins) — click a station name in the data area to center the map on it.
- Home marker (green house icon) — your configured home location. Can be toggled on/off.
- Map auto-zooms to fit all markers when the page loads.
If tidesy.local Doesn’t Work
The address tidesy.local works on most modern devices (macOS, iOS, Windows 10+, and most recent Android versions). If it doesn’t work on your device, use the device’s IP address directly instead (the IP address is shown during setup).
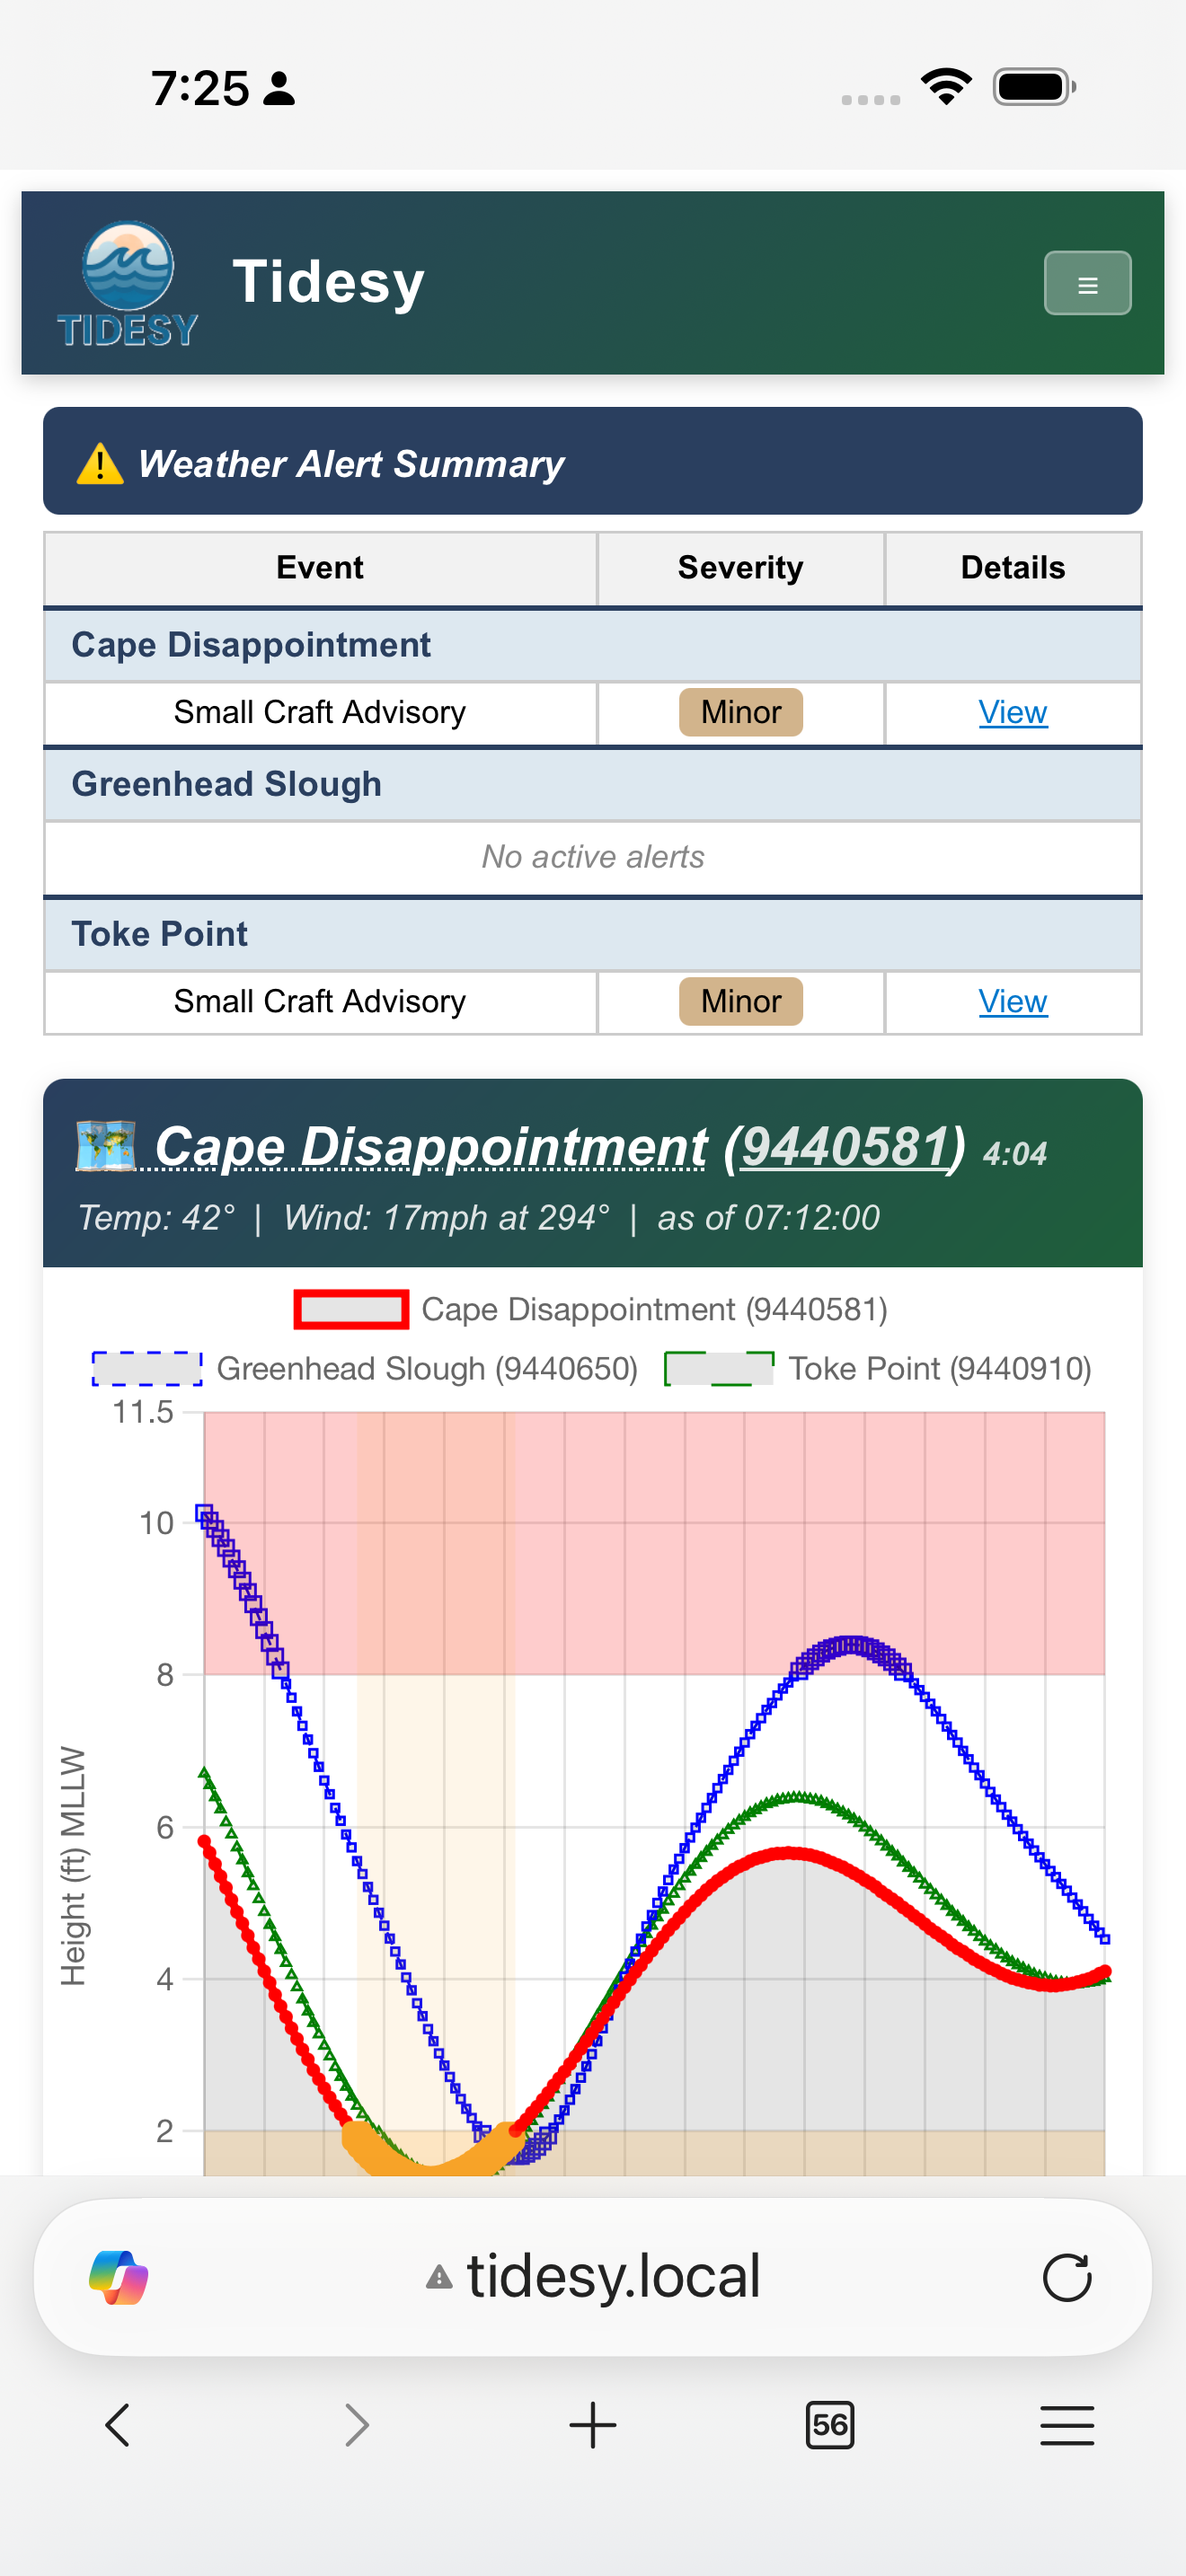
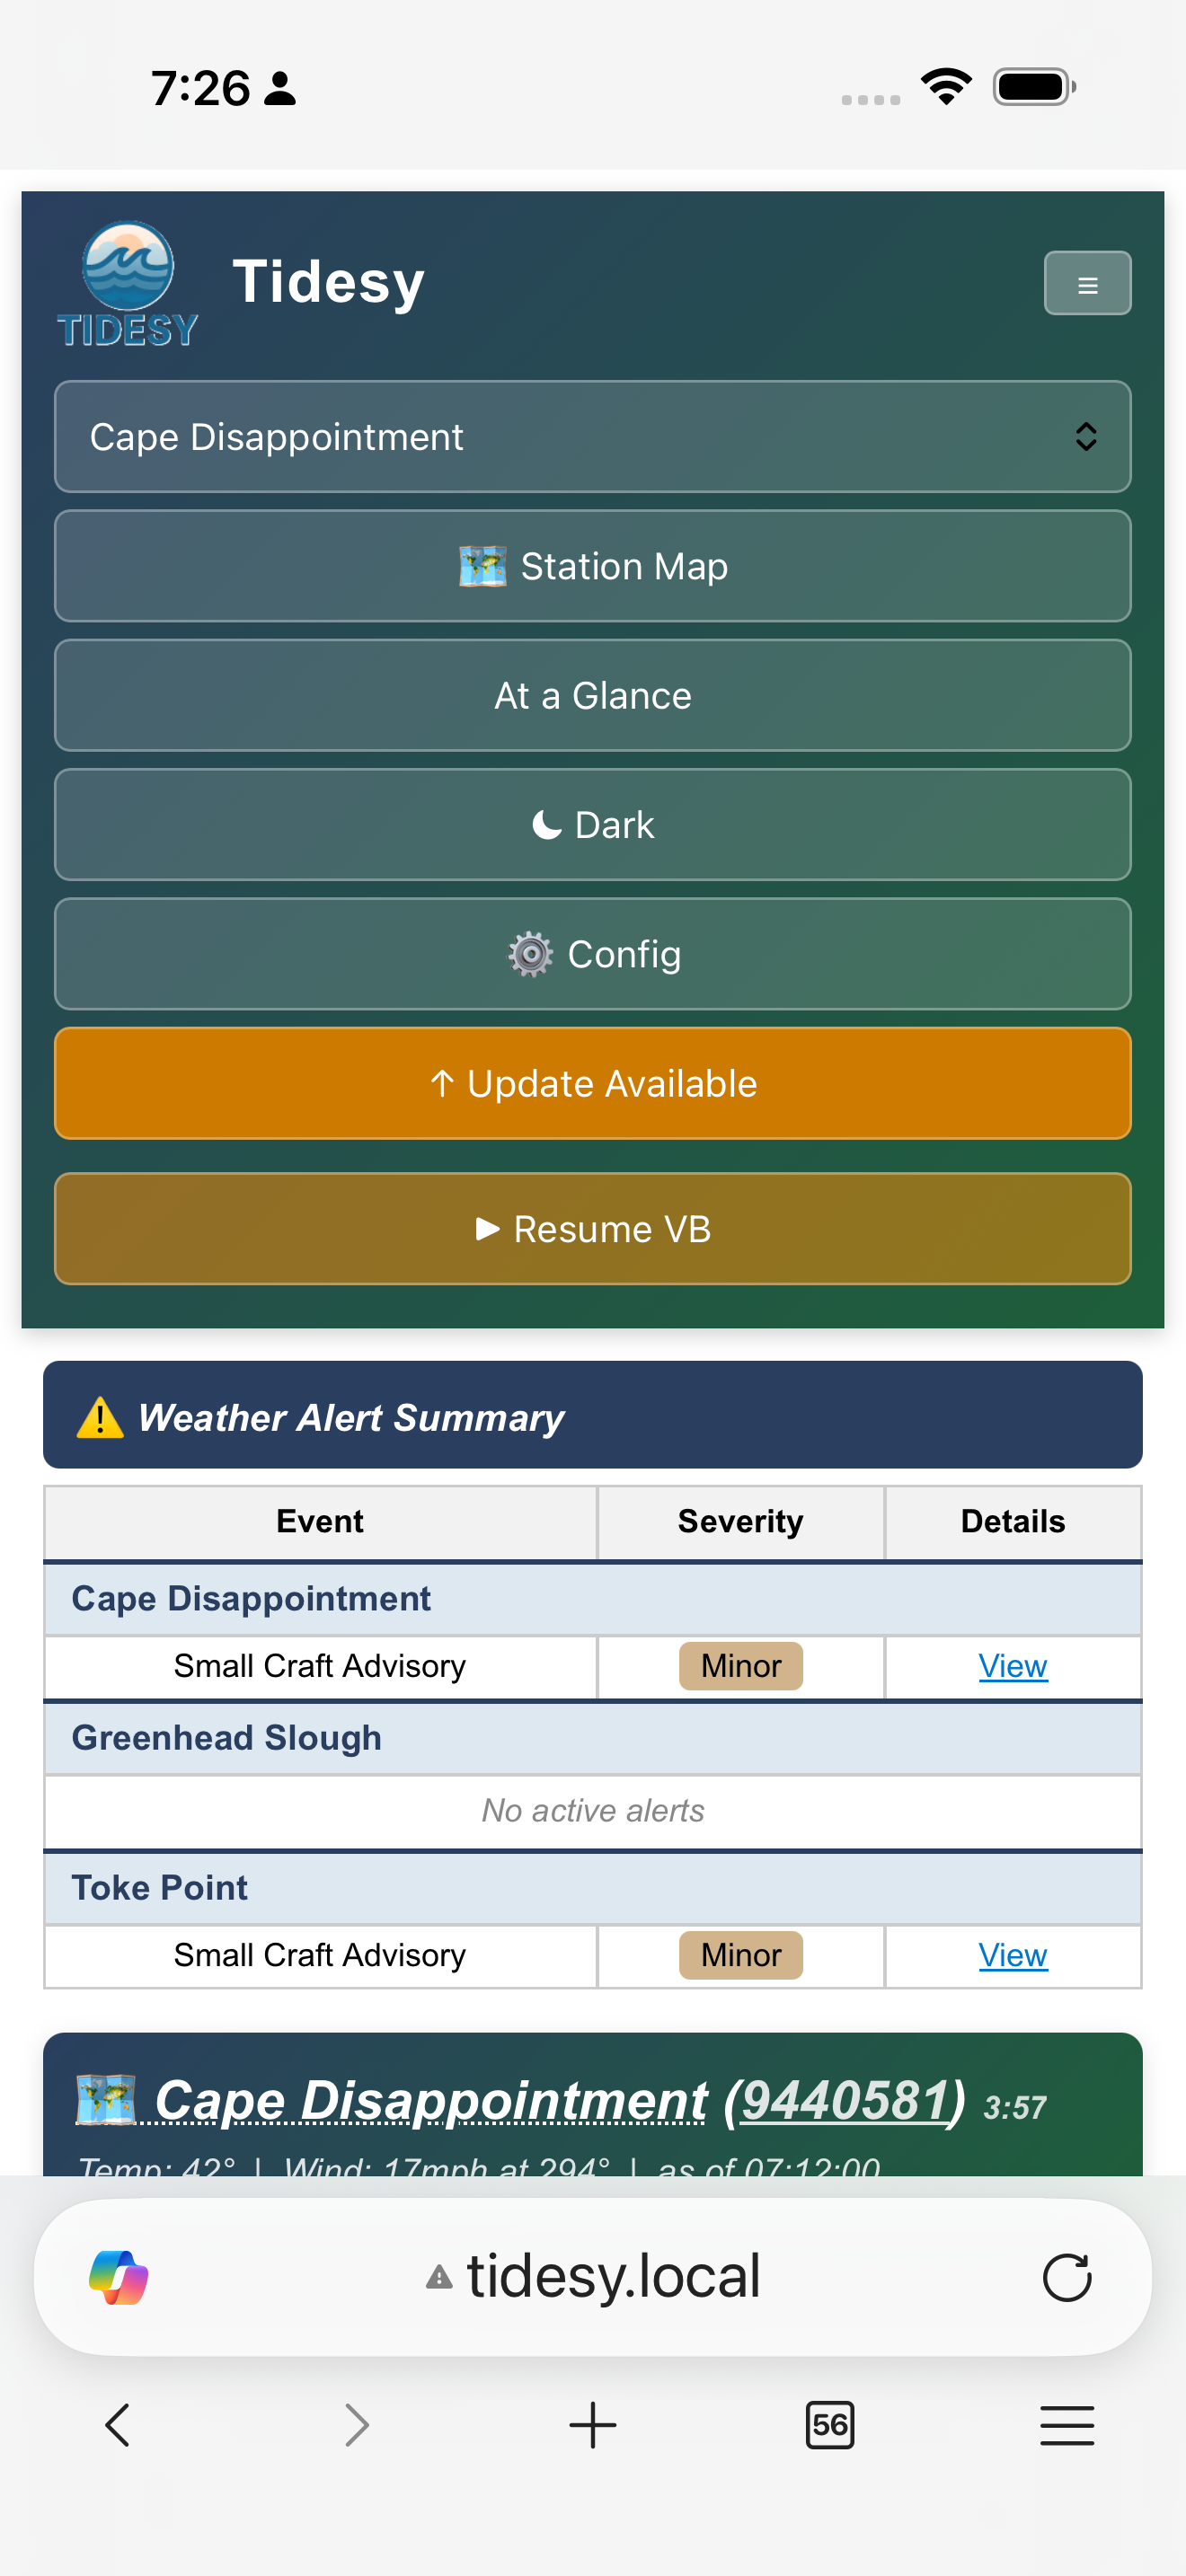
Mobile Dashboard
The web dashboard is fully responsive and optimized for phone screens. The navigation collapses to a hamburger menu, and all features are touch-friendly.
Tidesy Cloud (optional)
Your Tidesy device does not require a subscription. Everything described in the rest of this manual works locally on your home network, forever, with or without Tidesy Cloud. Cloud is an optional add-on that gives you remote access to the same dashboard from outside your home network — skipping it doesn’t disable a single feature on the device itself.
Everything described above is the local dashboard — it lives on your device and is only reachable from the same WiFi network. Tidesy also offers an optional cloud-hosted dashboard at https://app.tidesy.com so you can check your tides and conditions from anywhere — on your phone away from home, on a laptop at the office, shared with family on a different network. Cloud is fully opt-in. Nothing leaves your device until you turn it on.
Opting in
Open the local dashboard at http://tidesy.local (or your device’s IP) and click the ☁ Cloud button in the top-right action bar. The first time you click it, a consent dialog titled “Enable Tidesy Cloud?” appears, listing exactly what gets sent to the cloud (a random device token, the MAC address, your NOAA station IDs and coordinates, your display preferences, and the firmware version). Click I Agree, Enable Cloud to continue, or No Thanks to back out. The device immediately syncs to the cloud and a follow-up dialog appears with your dashboard URL.
Your dashboard URL
After consent, the Tidesy Cloud Dashboard dialog shows your URL in the form https://app.tidesy.com/d/<token>. Click Copy Link to copy it to your clipboard, then paste it into a phone bookmark, send it to family, or open it in any browser. The token is a random string unique to your device — anyone with the URL can view the dashboard but cannot change your device’s configuration. To revoke access (for example, if you ever shared a URL you wish to recall), factory-reset the device; a fresh token is issued on the next consent. The same ☁ Cloud button on the dashboard re-opens this URL dialog any time after the first opt-in.
Your cloud dashboard mirrors what the local dashboard shows — the same tide curves, weather, and alerts — rendered at app.tidesy.com/d/<token> for access from anywhere.
Free 6-month trial
Every new device gets 6 months of Tidesy Cloud free, starting the first time you open your dashboard URL. A countdown banner at the top of the dashboard shows how many days remain. You don’t need to enter payment details to start the trial — just consent on the device and open the URL.
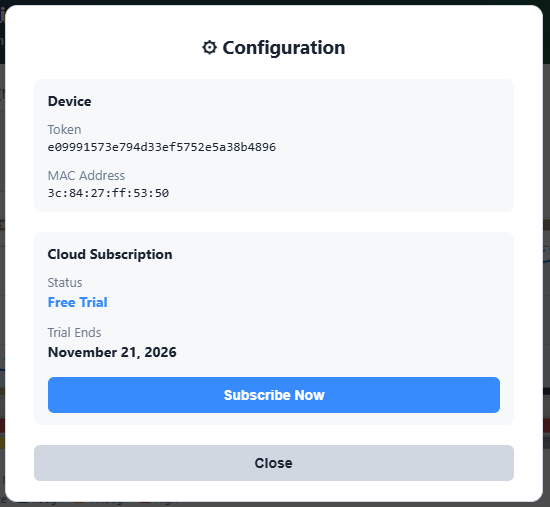
Trial countdown banner. Click Subscribe at any time to convert to a paid subscription — your remaining trial days are not lost.
Subscribing
To continue using Tidesy Cloud after the trial ends, purchase a subscription. Click the Subscribe button in the trial banner, or visit tidesy.com and pick the Tidesy Cloud subscription product. Checkout is handled by Shopify; once the order is processed, your dashboard switches into the paid state automatically — usually within a minute or two of payment confirmation.
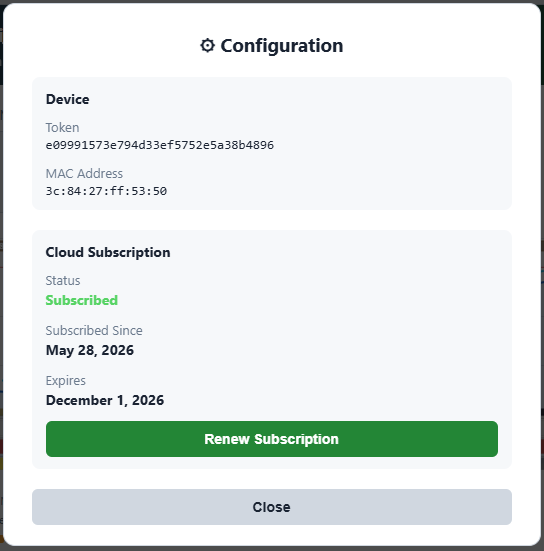
With an active subscription, the trial countdown is replaced by a subscription badge showing your renewal date.
After the trial
If you decide not to subscribe, nothing breaks — your device keeps working exactly as it always has, and the local dashboard at tidesy.local stays available on your home network. Only the cloud dashboard becomes unavailable. You can resume any time by purchasing a subscription; the same dashboard URL will start working again.
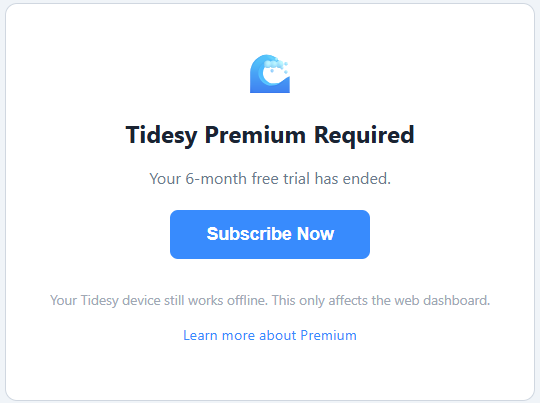
After the trial ends without a subscription, the dashboard shows a friendly subscribe prompt instead of the live data.
Privacy
Tidesy Cloud sees only what you’ve told the device to display: station IDs, display preferences (theme, brightness hours, warning levels), and a random device token. It does not see your WiFi password, your name, or anything you didn’t explicitly configure on the device. See Section 17 (Privacy & Data) for the full data-flow breakdown.
Turning it off
To stop syncing and remove your cloud-side data, factory-reset the device (see Section 16). The consent dialog mentions this explicitly: “You can remove your cloud data at any time with a factory reset.” After the reset the device boots fresh with no cloud token, your previous dashboard URL stops working immediately, and the cloud-side data is purged within 24 hours. Your local dashboard returns to its pre-consent state automatically.
8. Vestaboard Integration
What Is Vestaboard
Vestaboard is a premium smart display that uses mechanical split-flap characters to show messages, art, and data. Each board has a 6-row × 22-column grid of split-flap tiles that can display letters, numbers, and colors. Tidesy connects to a Vestaboard on the same WiFi network to show live tide data in a beautiful mechanical format.
Compatibility
Setup
- Network scan: Tidesy scans the local WiFi network and discovers any Vestaboard Flagship devices.
- API key: Enter the local API key (22-character encoded key). Obtain this from the Vestaboard app under device settings > Local API. You can paste a key from the clipboard using the clipboard button next to the input field.
- Interval: Select how often Tidesy updates the Vestaboard (see Update Modes below).
Update Modes
| Mode | Behavior |
|---|---|
| Change with device | Mirrors the Tidesy display instantly. When the device switches stations or views, the Vestaboard updates immediately. |
| 20m / 30m / 1h / 2h | Independent cycle through all stations and views. Each station shows: detail view (2 min), large view (2 min), and alerts (for the configured alert delay). Cycles to the next station after completing all views. |
VB Colors
Vestaboard tiles support 8 colors. You can configure which colors are used for:
- Positive tide values
- Negative tide values
- Zero mark
- Warning level indicator
- Preferred range indicator
Available tile colors: Red, Orange, Yellow, Green, Blue, Violet, White, Black.
Vestaboard Views
Tidesy sends three different views to the Vestaboard, cycling through them automatically:
Detail View
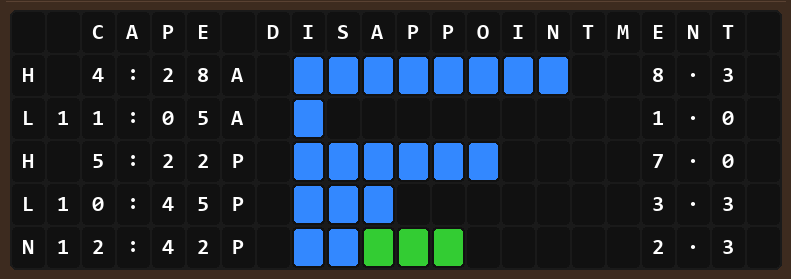
Shows the day’s tide schedule with high/low times and values. A color bar graph illustrates relative tide heights. The current tide level is highlighted in green.
Large View
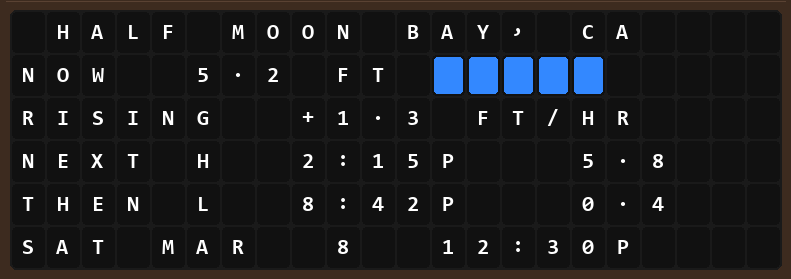
An at-a-glance summary showing the current tide level, rise/fall rate, next high and low, and the current date and time. A blue bar graph shows the current tide height.
Alert View
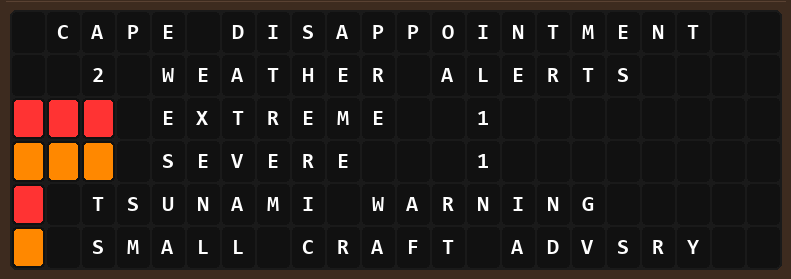
When weather alerts are active, the Vestaboard shows the alert count, severity breakdown, and event names with color-coded severity indicators (red = extreme, orange = severe, yellow = moderate).
9. Night Mode & Brightness
Automatic Switching
Tidesy automatically switches between day and night brightness based on the device’s internal clock. The clock is set automatically over the internet and adjusts for daylight saving time.
Settings
| Setting | Range | Description |
|---|---|---|
| Day Brightness | 1–100% | Backlight intensity during daytime (from night end to night start). |
| Night Brightness | 0–100% | Backlight intensity during nighttime. Set to 0% to turn the screen completely off. |
| Night Start | 0–12 PM | The PM hour when night brightness activates. |
| Night End | 0–12 AM | The AM hour when day brightness resumes. |
TidesyINK does not have brightness controls. E-paper displays are reflective (no backlight) and are readable in any lighting condition.
10. Multi-WiFi & Network
2.4 GHz Only
Tidesy supports 2.4 GHz WiFi only. 5 GHz networks are not supported.
Where to Place Tidesy
Tidesy connects to your WiFi wirelessly, but it can have trouble if it’s too close to certain devices. For the best experience:
- Keep at least 3 feet (1 meter) from your internet router or modem — that’s the box with blinking lights that your internet provider gave you. Being too close can actually make the connection worse, not better.
- Keep away from microwaves, baby monitors, and cordless phones. These devices send out signals that can confuse Tidesy’s wireless connection.
- Avoid metal shelves or metal-backed cabinets. Metal blocks wireless signals.
- Try a different power outlet if Tidesy keeps losing its connection. Some USB chargers and power strips can cause wireless problems.
WiFi Memory
Tidesy stores up to 30 known WiFi networks. WiFi passwords are encrypted on the device.
Auto-Reconnect
If the primary WiFi network becomes unavailable, Tidesy automatically scans for and connects to the strongest known network. Networks are prioritized by signal strength.
Per-Network Location Memory
When you move Tidesy between WiFi networks (e.g., home and beach house), the device remembers the location you set for each network. When you connect to a known network and re-enter setup, your previously saved location is automatically loaded. This means you don’t need to re-pick your location on the map every time you switch between familiar networks. Saved locations are cleared on factory reset.
tidesy.local
The device registers itself as tidesy.local on the network, allowing you to access the web dashboard and settings page without knowing the device’s IP address.
Required Internet Access
Tidesy requires internet access for the following services:
| Service | Domain | Purpose |
|---|---|---|
| NOAA Tides & Currents | tidesandcurrents.noaa.gov | Tide predictions and station data |
| National Weather Service | api.weather.gov | Weather alerts |
| MET Norway | api.met.no | Current weather (temperature, wind) |
| IP Location Service | ip-api.com | Location detection (optional, setup only) |
| Firmware Updates | Tidesy update servers | Firmware updates |
11. Firmware Updates
Automatic Update Check
Every time Tidesy boots, it checks for available firmware updates. This check happens silently in the background.
Mandatory Updates
Some updates are marked as mandatory (critical bug fixes or security patches). These are installed automatically and silently — the device will download, install, and restart without user interaction.
Optional Updates
When a non-mandatory update is available, an Update Available button appears on the web dashboard. Click it to review the update notes and install.
Update Process
- The update is downloaded and installed automatically over WiFi.
- The device display shows a dedicated update screen with a green progress bar, percentage counter, and “Do not turn off” warning.
- If updating from the web dashboard, a spinner overlay tracks progress in real time.
- Device automatically restarts after a successful update.
- A “Successfully Updated” banner appears on the web dashboard showing the new version number.
USB Web Updater (Fallback)
If your device can’t reach the internet for an over-the-air update — for example because of a restrictive guest network, captive portal, or local firewall — you can flash firmware directly over USB using the browser-based Tidesy Web Updater.
Open bernhardkohlmeier.github.io/tidesy-firmware-releases/updater/ in Chrome, Edge, or any Chromium-based browser on a desktop computer (the updater uses the Web Serial API, which Safari and Firefox don’t yet support). The page guides you through:
- Connecting the device to your computer with a USB-C cable.
- Clicking Connect and selecting the device’s serial port from the browser’s permission prompt.
- Choosing the firmware version you want to install from a dropdown.
- Clicking Flash — progress is shown in the browser.
The whole flash takes about a minute. The device restarts automatically when finished, and all your settings are preserved (the updater never erases your configuration, only the firmware partition).
12. TidesyINK Special Features
Power Modes
| Mode | WiFi Behavior | Refresh Cycle | Best For |
|---|---|---|---|
| High | Always on | Continuous (every 6 min) | Plugged-in, always-on use |
| Balanced | On during fetch, off between | Every 6 minutes | General use (default) |
| Low | Minimal (only during fetch) | Sleeps between refreshes | Battery operation, max battery life |
Battery Monitoring
TidesyINK monitors battery level and displays it on screen.
E-Paper Characteristics
- No backlight: Sunlight-readable, works in any lighting condition. Not visible in complete darkness.
- No color: All graphics are rendered in black and white.
- No animations: E-paper can only do full-screen refreshes. Partial updates may show ghosting.
- 6-minute full refresh: The screen fully redraws every 6 minutes to clear ghosting artifacts.
- Slight ghosting: Faint traces of previous images between refreshes is normal for e-paper technology.
13. LED Status Indicators
Only the TidesyS model has a status LED on the back of the device. Other models do not have an LED.
Boot Sequence (TidesyS Only)
During startup, the LED indicates progress through the boot sequence. Color changes correspond to WiFi connection attempts and initial data fetches. Once fully booted and connected, the LED settles to a steady state.
14. Touch Controls
TidesyL / TidesyM (Touchscreen)
These models have capacitive touchscreens with two interactive modes:
| View | Touch Action | Result |
|---|---|---|
| Detail View | Tap on the tide graph | Shows a vertical marker with the exact tide value and time at the tapped position. |
| Large View | Tap anywhere on screen | Toggles a bar chart overlay showing tide levels across the day on/off. |
Other Models
TidesyS, TidesyS+, and TidesyINK do not have active touch interaction on the display. Use the web dashboard for interactive features.
15. Troubleshooting
WiFi Issues
| Problem | Solution |
|---|---|
| Can’t find TidesySetup hotspot | Turn off WiFi on your phone, wait a few seconds, and turn it back on. If it still doesn’t appear, unplug Tidesy, wait 15 seconds, and plug it back in. Make sure your phone/computer is searching for 2.4 GHz networks, not filtering to 5 GHz only. |
| Can’t connect to home WiFi | Verify the network is 2.4 GHz. Double-check the password. Ensure the device is within WiFi range. |
| Display shows “WiFi not connected” or data keeps disappearing and coming back | Move Tidesy at least 3 feet (1 meter) away from your router (the box with blinking lights from your internet provider). Also move it away from microwaves, baby monitors, and cordless phones. Being too close to these devices can prevent a stable connection. If the problem continues, try plugging Tidesy into a different power outlet. |
| “WiFi not connected” on display | First, check that your other devices (phone, laptop) can still access the internet. If they can, move Tidesy at least 3 feet away from your router and other electronics, then restart Tidesy by unplugging it for 10 seconds. If your other devices also have no internet, restart your router. |
| Station names show *asterisks* and data looks stale | This means Tidesy briefly lost its connection while fetching data. If it keeps happening, move the device further from your router and other electronics. Tidesy will retry automatically every 6 minutes. |
Display Issues
| Problem | Solution |
|---|---|
| Blank screen | Check that the USB-C cable is securely connected and the power source provides at least 5V 2A. Try the reset button on the back of the device. |
| Frozen display | Press the reset button on the back of the device (use a paperclip for recessed buttons). |
| TidesyINK ghosting | Normal for e-paper. Ghosting clears on the next full refresh cycle (every 6 minutes). |
Data Issues
| Problem | Solution |
|---|---|
| "Fetching tide data" hangs | Check WiFi connection. NOAA API may be temporarily down — the device will retry on the next 6-minute cycle. |
| Asterisks (*) around station name | Indicates the tide data fetch failed for that station. The device will retry automatically on the next cycle. |
| "-x-" in weather area | Weather data fetch failed (MET Norway API issue). Will retry on next cycle. |
| No alerts showing | Verify "Show Alerts" is enabled in settings. Ensure your location is set. Check that your area is within NWS coverage (U.S. only). |
| Wrong tide values | Verify you selected the correct NOAA station. Check the tide datum setting (MLLW is the standard). |
Firmware Issues
| Problem | Solution |
|---|---|
| Update stuck | Do not unplug the device. Wait up to 2 minutes for the update to complete. If still stuck, power cycle the device. |
| Device won’t boot after update | Hold the reset button for 5 seconds. If the device enters setup mode, try a factory reset once the device is accessible (see Section 16). |
Web Dashboard Issues
| Problem | Solution |
|---|---|
| Can’t reach tidesy.local | Try the device’s IP address directly (shown during setup). Verify the "Web Server" toggle is enabled. |
| Stale data | Check the countdown timer on the dashboard. Force a browser refresh (Ctrl+Shift+R). |
| Map not loading | The map requires internet access to load OpenStreetMap tiles. Check your internet connection. |
Tidesy Cloud Issues
| Problem | Solution |
|---|---|
| Cloud dashboard URL won’t load | Make sure you’ve clicked the ☁ Cloud button on the local dashboard and accepted the consent dialog at least once. If the URL dialog shows “Sync failed” in red, the device couldn’t reach app.tidesy.com — check that the device has internet access (other live data should be loading). If the URL loads in your browser but shows a blank page, give it a few seconds for the cloud to pick up your config, then hard-refresh (Ctrl+Shift+R). If app.tidesy.com itself is unreachable, check that you’re online and that no firewall is blocking it. |
| Trial countdown banner missing | The trial starts the first time the dashboard URL is opened in a browser. If the device pushed its config to the cloud but no one has visited the URL yet, the trial hasn’t begun. Open the URL once on any device to start the clock. |
| Subscribed but dashboard still shows trial banner | Subscription state syncs from Shopify to the cloud usually within a minute or two. Force-refresh the dashboard (Ctrl+Shift+R) after a few minutes. If still stuck after 15 minutes, contact support with your order number. |
| Dashboard shows old configuration | Re-click the ☁ Cloud button on the local dashboard. Opening the URL dialog triggers a fresh sync automatically — the status line at the bottom of the dialog shows “Syncing to cloud…” then “✓ Synced to cloud” when complete. The cloud dashboard will reflect the new config within seconds. |
| Want to revoke a dashboard URL I shared | Factory-reset the device. A new token (and therefore a new dashboard URL) is issued on the next consent. The old URL stops working immediately at the cloud level once cloud is disabled. |
Environment Card Issues
| Problem | Solution |
|---|---|
| Clamming dig window not showing | Verify clamming is enabled in the admin panel (Environment > Clamming) and that you’ve picked a WDFW beach. Dig windows only appear within the authorized evening hours — if you check during the day, expect the band to be empty. |
| Clamming shows “Closed” | That’s a real WDFW closure (marine toxin advisory or off-season). The closure note explains why. Tidesy is reading the public WDFW schedule — if it says closed, harvest is not authorized. |
| Flooding overlay missing on a high tide | The overlay only appears when a forecast high will exceed the NOAA minor / moderate / major thresholds for your station. For stations without published flood thresholds, the feature is unavailable. Check that the Flooding toggle is enabled under Environment. |
| UV or AQI card not displayed | Both auto-hide when the value is irrelevant (UV at night, AQI when the data source returns nothing). Open the admin panel to verify the toggles are on under Environment. |
Vestaboard Issues
| Problem | Solution |
|---|---|
| VB not found during scan | Verify the Vestaboard and Tidesy are on the same WiFi network. Confirm the VB is a Flagship model (Note is not supported). |
| API key rejected | Re-enter the key carefully. Verify the key in the Vestaboard app under device settings > Local API. |
| Stale VB data | Check the update interval setting. Verify Tidesy has a WiFi connection. Try restarting the Tidesy device. |
16. Factory Reset & Recovery
Web Factory Reset
While connected to the same WiFi network as your Tidesy, type
tidesy.local/factory_reset into any browser’s address bar
and press Enter. A confirmation page will appear — click the button to
proceed. If tidesy.local does not resolve, use the device’s
IP address instead (e.g. 192.168.1.x/factory_reset).
What Gets Erased
- All preferences: WiFi credentials, station selections, display settings, Vestaboard configuration, visit counter, night mode settings, colors, and location.
- All per-SSID saved locations (up to 5 network-location pairs).
What’s Preserved
- Firmware (the device keeps its current version).
- Internal files (station directory, logo, help page).
After Reset
The device restarts and enters setup hotspot mode (TidesySetup / tide1234). You’ll need to go through the full setup wizard again.
Hardware Reset
Pressing the physical reset button on the back of the device restarts the firmware but does not erase any settings. This is equivalent to unplugging and re-plugging the device. Use this for a frozen or unresponsive display.
17. Privacy & Data
Local by Default
Tidesy operates fully locally by default. There is no cloud account, no login, and no app required — the device connects directly to public APIs for data and serves its dashboard on your home network. The optional Tidesy Cloud feature (see Section 7) is the only way data ever leaves your network, and it requires you to opt in explicitly on the device.
No Personal Data Sent
The only data Tidesy sends to external services without your opt-in are geographic coordinates (latitude/longitude) to fetch weather and tide data. No names, email addresses, or other personal information is transmitted by the default local operation.
APIs Called (Local Operation)
All APIs used by Tidesy’s local operation are public and require no authentication:
- NOAA (tidesandcurrents.noaa.gov) — Tide predictions
- NWS (api.weather.gov) — Weather alerts
- MET Norway (api.met.no) — Current weather
- IP location service (ip-api.com) — Location detection (used once during setup, optional)
Tidesy Cloud Data Flow (Opt-In Only)
If you opt in to Tidesy Cloud, the device pushes a small configuration payload to app.tidesy.com whenever your settings change (typically every few hours, when you reconfigure, or after a reboot). The payload contains:
- Your configured NOAA station IDs (e.g.,
9410230) - Display preferences — theme colors, warning levels, brightness hours, alert delay
- A randomly-generated device token used as the URL fragment for your cloud dashboard
- The device’s MAC address (so we can recognize your hardware after a factory reset)
What is never sent to the cloud:
- Your WiFi network name or password
- Your name, email address, or any account identifier
- Your home location coordinates (only the station coordinates, which are public NOAA data)
- Any browsing data, usage analytics, or telemetry
To stop the data flow at any time, factory-reset the device (see Section 16). Your cloud-side data is purged within 24 hours and any URL you’ve shared stops working immediately. A fresh token is issued on the next opt-in if you ever re-enable Tidesy Cloud.
Local Storage
All settings are stored securely on the device. WiFi passwords are encrypted.
No Tracking
Tidesy does not include any analytics, telemetry, or third-party tracking. The device does not phone home, report usage statistics, or share data with anyone — not in local operation, and not when Tidesy Cloud is enabled.
18. Glossary
Tide Terms
- Datum
- A fixed reference surface from which tide heights are measured.
- MLLW (Mean Lower Low Water)
- The average of the lower low water height each tidal day over a 19-year epoch. The standard datum for U.S. nautical charts.
- MSL (Mean Sea Level)
- The average height of the sea surface over a 19-year period.
- MHW (Mean High Water)
- The average of all high water heights over a 19-year epoch.
- Slack Water
- A brief period when the tidal current is near zero, occurring at the turn between flood and ebb.
- Flood Tide
- The incoming (rising) tide.
- Ebb Tide
- The outgoing (falling) tide.
- Spring Tide
- Tides with the greatest tidal range, occurring around new and full moons.
- Neap Tide
- Tides with the smallest tidal range, occurring around the first and third quarter moons.
- Harmonic Constituent
- A mathematical component representing one astronomical influence on tides (e.g., M2 for the principal lunar semidiurnal tide).
- Semidiurnal
- A tidal pattern with two nearly equal high tides and two nearly equal low tides per day.
- Diurnal
- A tidal pattern with one high tide and one low tide per day.
- Mixed Tide
- A tidal pattern with two highs and two lows per day of significantly different heights.
- Tidal Range
- The vertical difference between a high tide and the following low tide.
Technical Terms
- OTA (Over-The-Air)
- Firmware update delivered wirelessly over WiFi, without physical connection.
- E-Paper
- A display technology that reflects ambient light (like paper), requires no backlight, and retains the image without power.
- NWS (National Weather Service)
- U.S. federal agency that provides weather forecasts, warnings, and alerts.
- NOAA (National Oceanic and Atmospheric Administration)
- U.S. federal agency that operates the tide station network and provides tide predictions.
Tidesy Terms
- Detail View
- The 24-hour tide graph view showing the tide curve, time marker, and weather conditions.
- Large View
- The big-number view showing four tide values (High/Low/High/Low) with times and weather.
- Warning Level
- A configurable tide height threshold that triggers a colored band on the graph (e.g., for dock clearance).
- Preferred Range
- A configurable tide height range shown as a colored band on the graph (e.g., ideal fishing or surfing window).
- Alert Delay
- How many seconds each weather alert is displayed before cycling to the next (10–60 seconds).
- Night Mode
- Automatic brightness reduction during configured nighttime hours.
- Power Mode
- TidesyINK-specific setting that controls WiFi and sleep behavior (High / Balanced / Low).
19. Quick Reference Card
Tidesy Quick Reference
tide1234
192.168.4.1
http://tidesy.local
tidesy.local/factory_reset